
In Ontario, there is mourning about the loss of manufacturing jobs. There is concern about the growth of precarious service jobs. And there is enthusiasm about the prospects of knowledge-based jobs. But in the midst of all of this, where are the present-day middle-income jobs?
Figure 1 | Share of all jobs in Ontario (1987-2017) by industry groups*
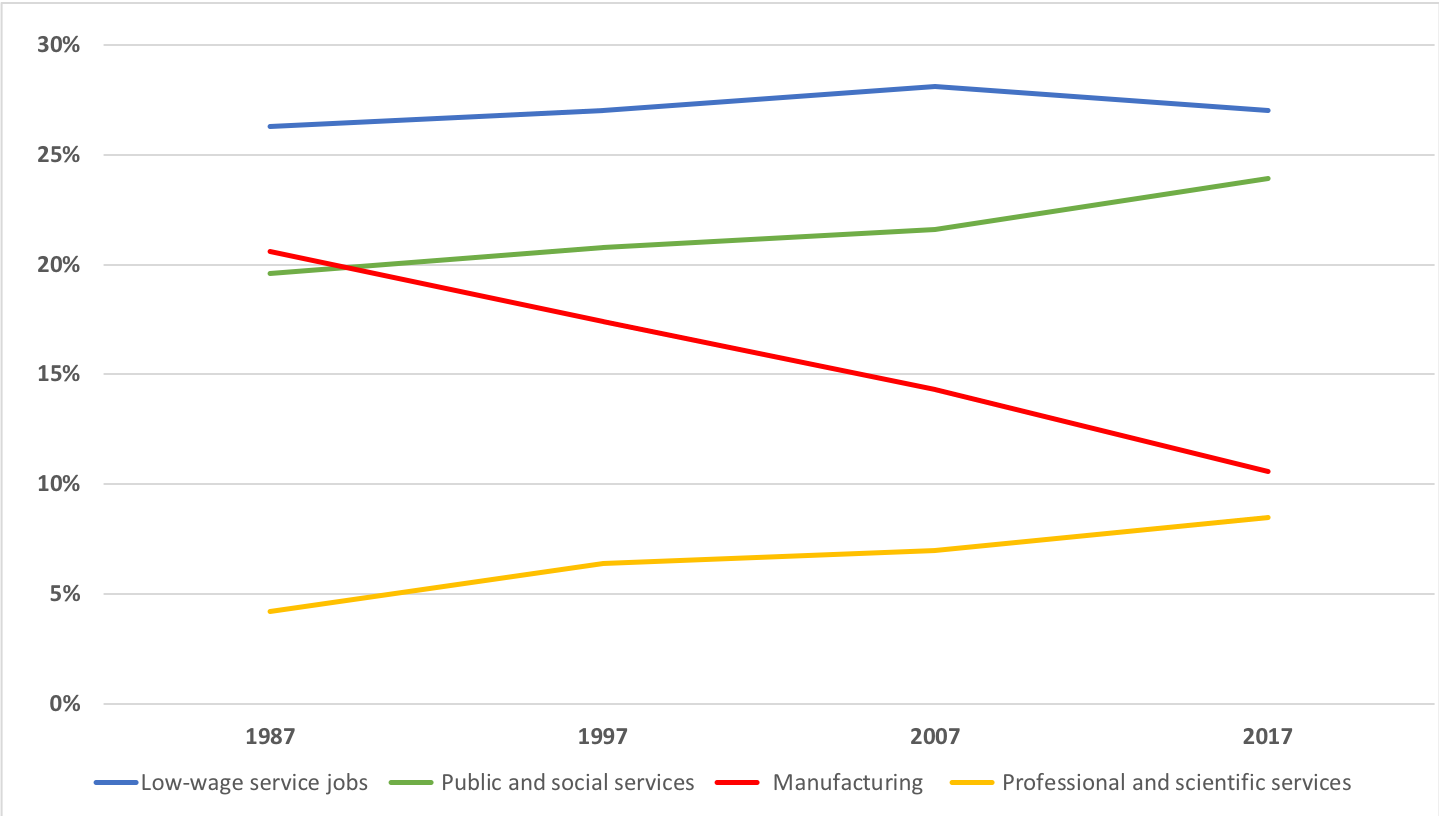 Source: Labour Force Survey Public Use Microdata File and author’s calculations. *Industry groups not included in this graph account for between 29 per cent (1987) and 30 (per cent) of all jobs.
The red line in Figure 1 depicts the widely known and harshly felt decline of manufacturing jobs: it dropped from 21 to 11 per cent of all jobs in Ontario between 1987 and 2017. The blue line shows the trend for low-wage service jobs: retail, accommodation, food services, administrative and facilities support services, and paid domestic work.¹ Their share of all jobs has remained steady at 27 per cent in the past 30 years.
The yellow line illustrates the rise of knowledge-based jobs, which are spread throughout many traditional sectors and occupations, but largely captured under the professional, scientific, and technical services industry group.² These jobs represent a growing portion of all jobs—9 per cent in 2017.
The green line shows an underreported fact: almost one in four jobs in Ontario (24 per cent) are in the public and social services, namely education services, health care and social assistance, and public administration. Most of these services are provided by governments and public institutions, as well as not-for-profit and charitable organizations. The 4 per cent increase in the share of jobs in this sector is concentrated in health care and social assistance. Contrary to political rhetoric, the share of public administration jobs—5 per cent—has remained steady since 1987.
Figure 2 | Average wages by industry group, Ontario 2016
 Source: Statistics Canada, 2016 Census, Employment Income Statistics by NAICS 2012. Click the image to expand size.
As Figure 2 shows, manufacturing jobs (red bar) are the typical middle-income jobs, with the average wage in this industry very close to the average for all industries in Ontario. Wages in health care and social assistance are slightly lower than those in manufacturing, while wages in education services are slightly higher (green bars). Public administration has higher average wages. Accommodation and food services, administrative and facilities support, other services (including paid domestic workers), and retail fall well below the average wage (blue bars). Professionals, scientists, and technicians earn above-average wages (yellow line).
To sum up: public and social service jobs are not only one in four jobs in the province, but also the jobs more likely, on average, to provide a middle-class lifestyle akin to what manufacturing jobs offered previous generations. They are Ontario’s last reservoir of middle-class jobs.
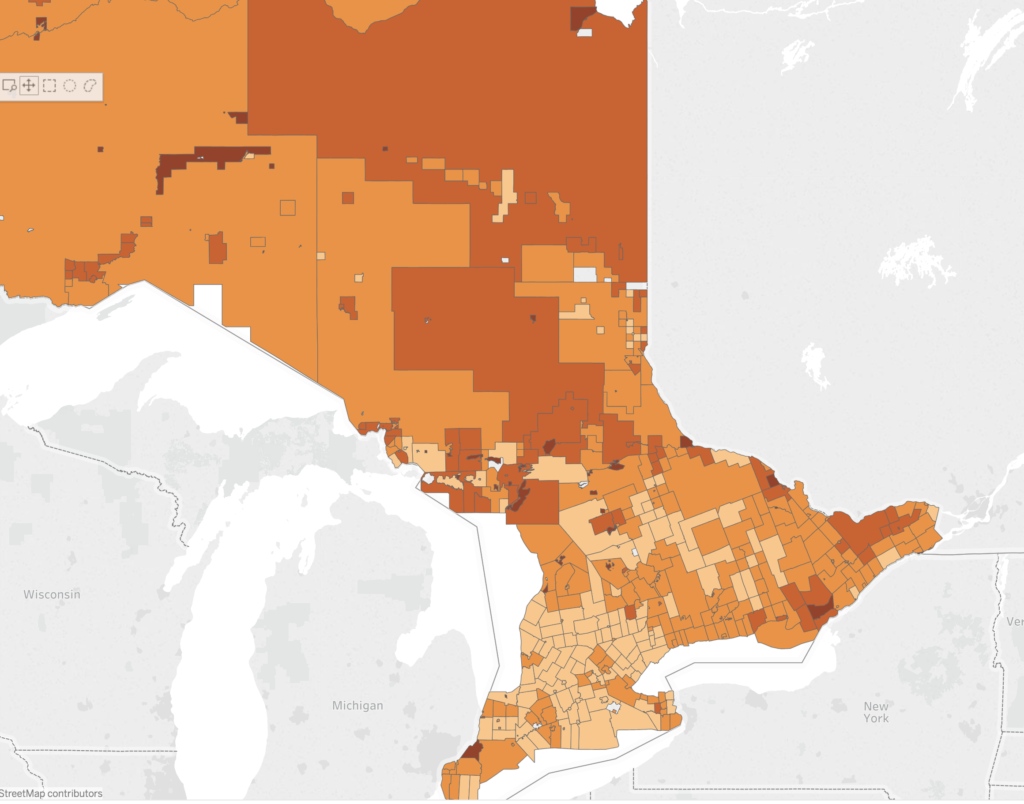
And if individuals and families rely on public and social sector jobs to secure decent income, so do communities. Twenty-four percent is the average proportion of public and social sector jobs in Ontario. As map 1 shows, the percentage is considerably higher in many communities across the province—be it Sarnia (36 per cent), North Bay (35 per cent), Quinte West (34 per cent), Peterborough (31 per cent), Essa (33 per cent), or Kenora (39 per cent). In Toronto (proper), the share of public and social services jobs (22 per cent) as a percentage of all jobs in the city is below the provincial average.
Map 1 | Public and social sector jobs as a share of all jobs by census subdivisions (municipalities)

The images that come readily to mind are long hospital wait lines, crowded, dilapidated classrooms, increased homelessness, poorly maintained roads, and slow government responses to crisis situations. This is likely to happen. But regretfully, that’s not all.
One should also picture a deserted Main Street, closed shops with peeling paint facades, old folks talking about days when there were jobs in town, while the children and grandchildren pack their bags. At least this is what happened to many Ontario towns the last time middle-class jobs disappeared.
With the closing of manufacturing plants, towns that once had a life of their own have become dependent on the regional centres where one finds the closest medical centre, the closest high school, the closest employment office, the closest mall. Which are not really that close.
Cuts in public service jobs would put these regional centres on the same path as former industrial towns. This time around it wouldn’t be as shocking or sudden as the closing of a factory, but the small blows would bring the same pain, in the end.
Here’s hoping we’ll find ways to leverage the economic capacity of hospitals, universities, transit agencies, municipal governments, and other public institutions instead of seeing them as a waste of tax dollars. Here’s hoping we’ll value the vital services they provide and astutely use their budgets and paid wages to reignite local economies.
Because public services aren’t just about helping us get access to good health care, education, and social services. They’re an economic lifeline in communities across this province.
¹ The Labour Force Surveys aggregates industry groups 55 and 56 of the North American Industry Classification System (NAICS). Group 56 includes administrative and support services, waste management, and remediation services. Group 55 includes management services. Average wages for these two groups are quite different (as showed in Figure 2). In 2016, in Ontario, group 55 accounted less than four per cent of the jobs when the two categories are combined. Thus, the author opted for including this aggregate in the computation of low-wage service jobs.
² The group 54 of the NAICS – Professional, scientific, and technical services – includes specialized design services; management, scientific and technical consulting services; computer system design and related services; scientific research and development services; architectural, engineering and related services; as well as “all of professional, scientific, and technical services.” This is a good proxy for what is often referred to the knowledge-industry or the creative sector.
Ricardo Tranjan is a senior researcher with the Canadian Centre for Policy Alternatives’ Ontario office. Follow Ricardo on Twitter: @ricardo_tranjan.