
Over the past year, following changes to education funding in Ontario has felt like watching a cups and ball magic trick. Contradictory government announcements, the usage of obtuse terms such as "attrition protection," and the moving of money between funding envelopes have created a general sense of confusion as to what is happening to schools in this province. It shouldn’t be this way.
Our children’s wellbeing depends on what happens to schools; we have the right and the duty to understand what’s going on.
In a previous article (If it looks like a cut and it hurts like a cut, then it probably is a cut), I discussed total education figures in the 2019 Budget. Here, I look at operating allocations (prior to capital adjustments) for school boards, comparing funding received for the 2017-2018 school year with estimates for the 2019-2020 school year. The comparison is adjusted for inflation; per-student calculations use estimated enrollment figures available as of August of 2019.
This is a straightforward way of finding out how much funding school boards will receive this year, in total, and per student, in comparison to how much they received two years ago, the last complete school year before the current provincial government came to power.
This comparison doesn’t capture all the changes that will affect the education sector. Most notably, it doesn't account for changes in infrastructure funding, class-size funding adjustments that will take effect throughout the year, and cuts to public and community services that directly impact the quality of education. In sum, this comparison captures only a portion of education funding cuts.
The interactive map below shows total funding change, total funding percentage change, and per-student funding change for Ontario school boards across the province, mapped by school system (English public school boards, English Catholic school boards, Conseils scolaires publics, Conseils scolaires catholiques). Please note: the map is optimized for desktop viewing. Click to explore the board by board funding situation, and read more about the findings below.[1]
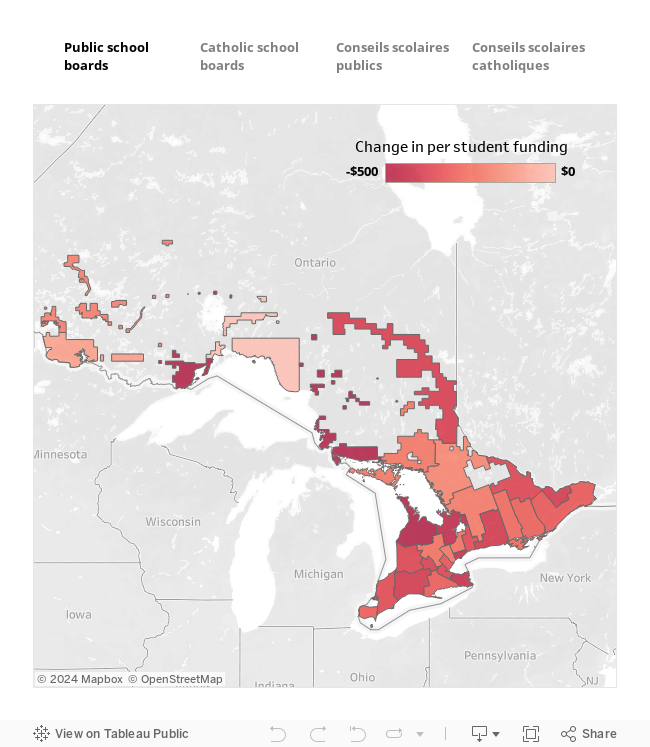
Here are the highlights:
All school boards are experiencing cuts in total operating funding or in per pupil funding.
For the 2019-2020 school year, the Ontario government is transferring $430 million less (adjusted for inflation) to school boards than the amount transferred in 2017-2018. That’s a (real) 2% cut in total operating funding.
The percentage change in total funding for individual school boards ranges from -6% to +5%. Trillium Lakelands DSB (-6.5%) and York Catholic DSB (-6.3%) are seeing the highest percentage cut in total operating grants. Sixteen of the 72 school boards have an increase in total operating funding, but all 16 have cuts in per student funding. In other words, the increase was smaller than what was necessary to make up for enrolment growth: they have less money per student overall.
The total average funding per student dropped by $375 (adjusted for inflation). That's a 3% cut. Only four of the 72 school boards will see an increase in per student funding. Some boards will shoulder steeper cuts. The Conseil des écoles publiques de l'Est de l'Ontario, for example, will see a reduction of $753 per pupil. Toronto DSB is losing $456 per student.
These changes in total school board allocations will impact several specific funding envelopes.
In addition to total and per-student figures, the interactive map shows changes to the Learning Opportunities Grant (LOG). Initially set up to assist students living in socioeconomic contexts that increase the chances of lower academic achievement, this grant has been increasingly used to fund a variety of programs, including supports for students with learning disabilities.
The 2019-2020 funding estimates include a 36% cut to the LOG grant, in comparison to 2017-2018 amounts (adjusted for inflation). No school board has been spared. Some boards are facing cuts as large as 76% (York Catholic DSB). Toronto DSB is losing 62% of this funding grant.
Misleading announcements can only conceal so much: a cut is a cut. And these cuts will have many short and long-term negative impacts on Ontario’s children and youth.
Ricardo Tranjan is a senior researcher with the Canadian Centre for Policy Alternatives’ Ontario office. Follow Ricardo on Twitter: @ricardo_tranjan.
[1] Map source: Ontario Ministry of Education. 2017-2018 School Boards Financial Statements; 2019-2020 School Boards Estimates; calculations by the author.