Kudos to the Globe and Mail for their front page story on Jan 23rd highlighting the fact that the official unemployment rate does not count First Nations reserves. You heard that right: First Nations reserves, some of the poorest places in the country, are not included in the official unemployment rate.
As unbelievable as that sounds, the reality is even worse. Reserves are regularly excluded from all of our regularly updated measures of poverty, wage growth, average incomes etc. The exception to this rule is during a Census, i.e. every four years (and as a result of legislation making the long form Census voluntary, concerns have been raised about the future reliability of these data). Otherwise, reserves—some of the poorest places in Canada--are statistic-free zones: out of sight…out of mind.
As someone who works regularly with Statscan data, this was hardly news to me. But I’m glad this issue has finally gotten the attention it deserves. How can we have an accurate picture of what’s happening in Canada when we’re actively and deliberately excluding some of the poorest parts of our country from our basic statistics?
But what might unemployment would look like in Canada if reserves were included? Since this data isn’t collected monthly, the only reliable figures are from the first week of May 2011, when the National Household Survey (NHS) was conducted. As you can see in Table 1, the seasonally unadjusted unemployment rate for Canada is 7.6% (close to the comparable Labour Force Survey (LFS) estimate of 7.5% in that month)—but on reserves it is a shocking 22%. Had reserves been included in the calculations, the Canadian unemployment rate would have been 7.8%, not the official 7.6%.
Table 1: May 2011 employment figures
Note: non-seasonally adjusted, NHS Individual PUMF, 15 years and over
When reserves are included in the calculations, the employment rate (the proportion of the working age population that has a job) falls from 61.1% to 60.9%—pretty incredible, considering people on reserves make up only 1% of the Canadian population.
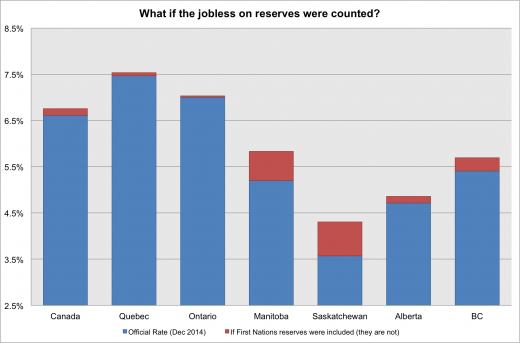
That’s for 2011, but what would it look like today? Figure 1 shows that, once reserves are included, the unemployment rate is a little worse than the “official” statistics indicate for Canada, Ontario and Quebec. But it is substantially worse for the Prairie provinces and BC. If everyone was counted, including folks on reserves, the unemployment rate in December 2014 would have jumped from 5.2% to 5.8% in Manitoba; and in Saskatchewan from 3.6% to 4.3%. BC would see its rate go from 5.4% to 5.7%.
Figure 1:
 Excluding the poorest places in Canada from basic data collection may paint a rosier picture, but certainly not a truthful one. Canada has a responsibility to First Nations peoples who live on reserve, and they deserve to be counted. Yes, that will cost more money, but not including people on reserves in our data-gathering allows us to continue to ignore the appalling poverty that we’ve both facilitated and allowed to deepen for generations in our wealthy country.
Notes for Stats Nerds: These calculations are approximations. The “on-reserve” designation was imputed by using band membership crossed with non-CMA locations from the NHS Individuals PUMF. This is clearly not perfect and should be treated as a proxy. This approach, while fast, overestimates the number of people on reserves. I’m applying differences in non-seasonally adjusted figures from 2011 to seasonally adjusted LFS data from Dec 2014. Those differences may not hold, although there is really no way of knowing since reserves aren’t included in the LFS.
Regular data collection should happen on reserves, but the responsibility for its non-collection shouldn’t be placed entirely at the feet of Statistics Canada. It’s more expensive to collect data on reserves, particularly if they are remote, and after austerity-driven budget cuts, Statistics Canada’s resources have been significantly stretched.
David Macdonald is a Senior Economist with the CCPA. Follow David on Twitter @DavidMacCdn.


