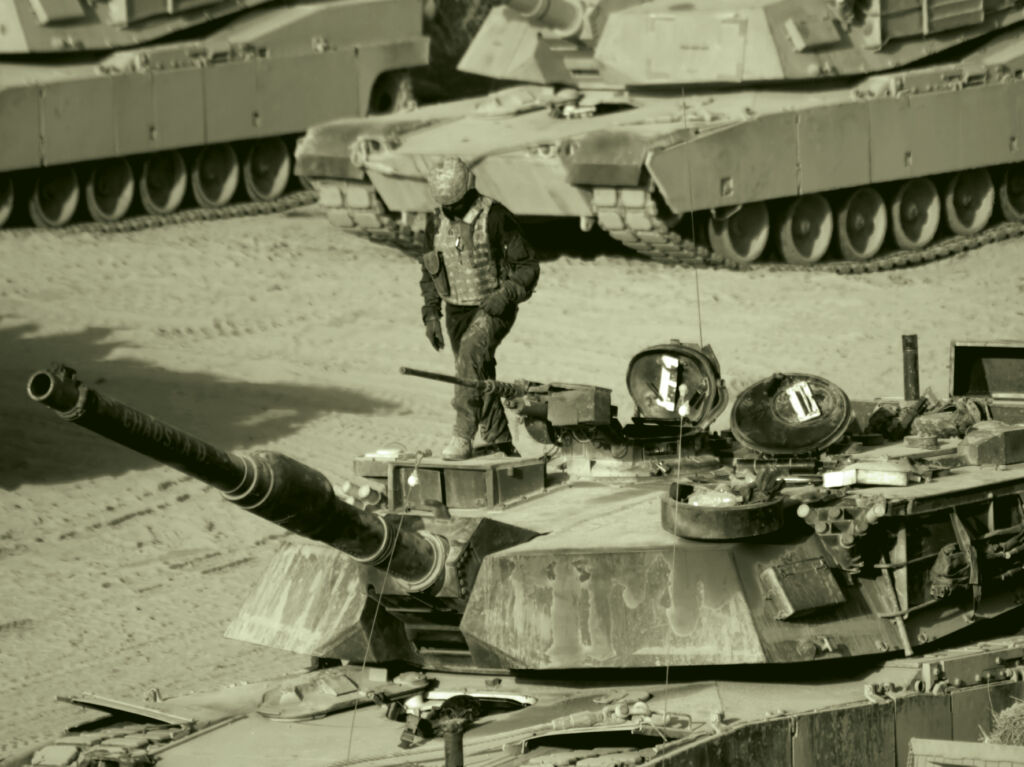

On October 7, 2001, the War on Terror began when American troops under President George W. Bush’s direction invaded Afghanistan. When considering how these post 9/11 military actions and anti-terrorism measures have unfolded, some numbers jump to mind more readily than others. Like the over $14 trillion that the Pentagon has spent since the start of the invasion of Afghanistan—with over a third of those dollars going to military contractors like Lockheed Martin and Boeing.1 Or the $2.5 billion that weapons makers have spent since 9/11 lobbying American Congress members.2 The most incomprehensible are the nearly 1 million people, including civilians, humanitarian workers, and journalists, who have been killed in military invasion-related violence.3 The 38 million people displaced by post-9/11 invasions and conflicts in Afghanistan, Iraq, Pakistan, Syria, Libya, Yemen, Somalia and the Philippines.4
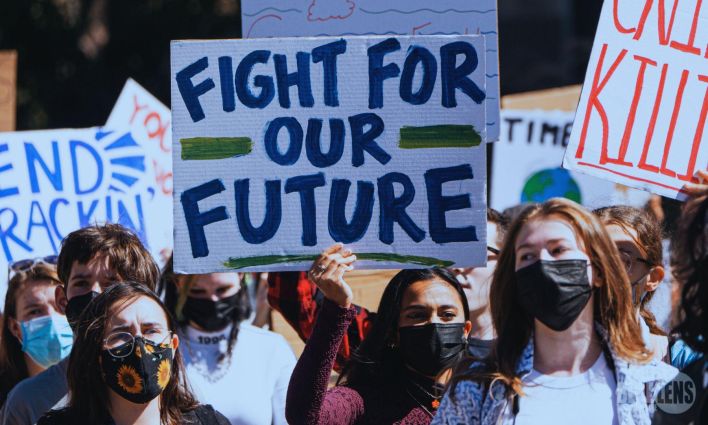
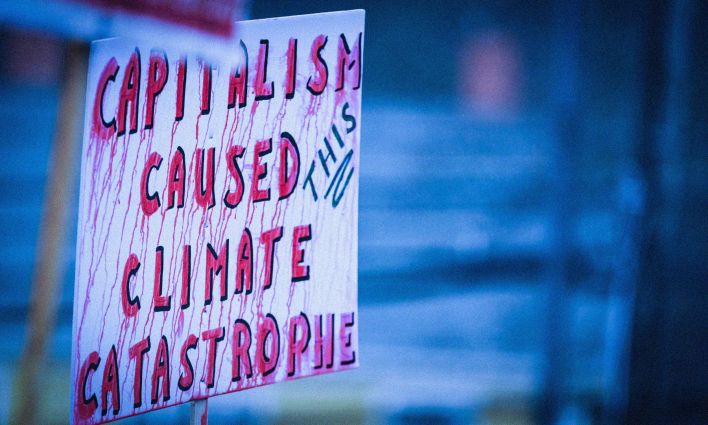
But another story is looming still. The story of how national defence programs contribute to global greenhouse gas (GHG) emissions. Here, the American Army is the standout—but not the standalone—example of how military operations are contributing to countries missing their emissions reductions targets. As Neta C. Crawford, the Co-Director of the Costs of War Project at Brown University remarked in her study on the Pentagon’s GHG emissions, “War and preparation for it are fossil fuel intensive activities.”5
“War and preparation for it are fossil fuel intensive activities.” Neta C. Crawford, Co-Director of @CostsOfWar

1: The US Department of Defense’s (DoD) global rank as the single largest institutional/organization consumer of petroleum products. The DoD is also the largest U.S. government user of energy.6
1.2 billion tonnes: The amount of GHGs that the U.S. military emitted between the beginning of the Global War on Terror in 2001 and 2018.7
122.4 million: the average annual number of barrels of oil purchased by the U.S. Defense Logistics Agency following the 9/11 attacks. The Agency’s annual petroleum purchases peaked between 2002 and 2012 when they averaged 134.3 million barrels per year.8
269,230: number of barrels of oil the U.S. military purchased on an average day in 2017. As one research team explained, “if the U.S. military were a country, it would nestle between Peru and Portugal in the global league table of fuel purchasing.”9
16: gallons of fuel per day per soldier on average that the U.S. operations in Iraq and Afghanistan burned in 2006. In the 1990-1991 Persian Gulf War, the rate was 4 gallons of fuel per soldier per day.10
66 million tonnes: The average annual amount of CO2 equivalent produced by the U.S. Department of Defence from 2010 to 2018.11
742: The number of operational army bases that the United States had as of July 2021.12
153: The number of countries in 2018 whose CO2 emissions in 2018 were less than the U.S. Department of Defence’s (DOD). Only 55 countries had emissions equivalent to or greater than the DOD.13
950.9: kilo tonnes of CO2 equivalent emitted by Canada’s National Safety and Security (NSS) fleet in fiscal year 2019-2020. The Department of National Defence (DND), generated 542 kilo tonnes of CO2 equivalent in the same time period. The DND is the largest source of federal emissions.14
90%: The Government of Canada’s GHG emissions reduction target, which it intends to reach by 2050. The government intends to achieve this by reducing emissions by an additional 10% every 5 years beginning in 2025. However, “the 40% and 90% absolute emission reduction targets do not apply to the NSS fleet.”15
For more information on the role that DND emissions play in Canada’s GHG emissions, check out Hadrian Mertins-Kirkwood and Jonah Somers’s 2021 report, Leading the way? A critical assessment of the federal Greening Government Strategy, available at policyalternatives.ca/LeadingTheWay.
Notes
Special thanks to Hadrian Mertins-Kirkwood for his assistance with this issue’s Index.
1 Hartung, W.D. (2021). Profits of War: Corporate Beneficiaries of the Post-9/11 Pentagon Spending Surge. Centre for International Policy, Watson Institute, Brown University. https://watson.brown.edu/costs...
2 ibid.
3 Crawford, N.C. & Lutz, C. (2021). Human Cost of Post-9/11 Wards: Direct War Deaths in Major War Zones, Afghanistan & Pakistan (Oct. 2001 – Aug. 2021); Iraq (March 2003 – Aug. 2021); Syria (Sept. 2014 – May 2021); Yemen (Oct. 2002-Aug. 2021) and Other Post-9/11 War Zones. Centre for International Policy, Watson Institute, Brown University. https://watson.brown.edu/costs...
4 Vine, D., Coffman, C., Khoury, K., Lovasz, M., Bush, H, Leduc, R., & Walkup, J. (2021). Creating Refugees: Displacement Caused by the United States’ Post-9/11 Wars. The researchers caution that 38 million is a “very conservative estimate” and that the number could be closer to 49-60 million, rivalling the displacement caused by World War II. Retrieved from: https://docs.google.com/spread...
5 Crawford, N.C. (2019). Pentagon Fuel Use, Climate Change, and the Costs of War. Watson Institute for International and Public Affairs. Brown University. https://watson.brown.edu/costs...
6 Nuttall, W., Samaras, C., & Bazilian, M. (2017). Energy and the military: Convergence of security, economic, and environmental decision‐making. University of Cambridge Energy Policy Research Group, 1717, 1–29. https://doi.org/10.17863/cam.1..., Toni Nagy produced an important video in 2021 on TikTok to raise awareness of the connection between military action and GHG emissions. https://www.tiktok.com/@toni.n...
7 Nuttall, W., Samaras, C., & Bazilian, M. (2017). Energy and the military: Convergence of security, economic, and environmental decision‐making. University of Cambridge Energy Policy Research Group, 1717, 1–29. https://doi.org/10.17863/cam.1...
8 ibid.
9 Belcher, O., Bigger, P., Neimark, B., & Kennelly, C. (2020). Hidden carbon costs of the “everywhere war”: Logistics, geopolitical ecology, and the carbon boot‐print of the US military. Trans Inst Br Geogr. 2020;45:65–80.. https://doi.org/10.1111/tran.1...
10 Crowley, T.D., et al. (2007). Transforming the Way DOD Looks at Energy. An Approach to Establishing an Energy Strategy. LMI Government Consulting. https://apps.dtic.mil/sti/cita...
11 ibid.
12 Vine, D. (2021). Lists of U.S. Military Bases Abroad, 1776-2021, American University Digital Research Archive. Retrieved from: https://doi.org/10.17606/7em4-hb13.
13 Author’s calculations, data from Muntean, M. et al. (2018). Fossil CO2 emissions of all world countries. European Commission Joint Research Centre. https://publications.jrc.ec.europa.eu/repository/handle/JRC113738 compared with data provided by Crawford, N.C. (2019). Pentagon Fuel Use, Climate Change, and the Costs of War. Watson Institute for International and Public Affairs. Brown University.
14 Government of Canada (2020). Government of Canada’s Greenhouse Gas Emissions Inventory. Retrieved from: https://open.canada.ca/data/en...
15 ibid.