It’s near impossible to ignore the current debate regarding the Québec Values Charter. It would seem laudable at first for a society to decide to reflect on its shared values. There is no cause to rejoice in the face of the current debate: it is certainly not the relevant exercise it could have been. Discussions about our values regarding the exploitation of our resources, the occupation of our land or our willingness to remain within our ecosystem’s limits are not on the agenda. Also off topic are Québec’s values in crucial aspects of society: universal access to free and quality health services, care for our elderly, or public education free from the pressures of businesses. The items listed above do not belong to the realm of Québec values, we are told.
What is presented as a debate about “our values” is indeed nothing but a lame remake of the 2006-2007 melodrama surrounding reasonable accommodations which led to the Bouchard-Taylor Commission. The current government, clearly anxious about hiding the fact that it is incapable to address the issue directly, has instead produced this so-called “values charter”. Quite frankly, IRIS researchers are far from being experts in secularism or in theorizing intercultural public space. It is certainly not up to us to speculate on the potential backlash it could cause to the sovereigntist movement by alienating once more immigrants or people of immigrant descent. However, IRIS has endeavoured in recent years to better understand the realities of integration in its most crucial aspect: labour. Viewed from this angle, the debate on the character and size of religious symbols seems unbelievably childish.
A discriminatory labour market
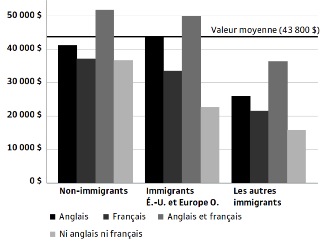
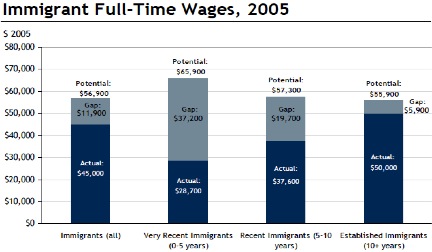
In the fall of 2012, IRIS associate research Mathieu Forcier published a research paper which raised questions about the integration of immigrants in the work force. It shows that there is systematic discrimination regarding immigrants, a phenomenon much more problematic for Québec’s social cohesion than all of the province’s headscarves and turbans put together. In 2006, the unemployment rate for the whole of Québec reached 8.1%, but it hit 11.2% for immigrants aged 25 to 54, i.e. those most susceptible to be looking for work. It would be interesting to check in the data provided by the most recent census whether or not this gap has widened in the wake of the last economic crisis. Beyond unemployment data, one also realizes reading the next two graphs that immigrants are at a disadvantage even if they do find a job.
Average wage for immigrants in Canada, 2005
Source: Dawn Desjardins and Kristen Cornelson, “Immigrant labour market outcomes in Canada : The benefits of addressing wage employment gaps,” RBC Economics Research, 2011, p. 2.Average income vs. knowledge of an official language
 Source: Nong Zhu and Alain Bélanger, L’emploi et le revenu des immigrants à Montréal: analyse des données du recensement de 2006, INRS-UCS, Emploi Québec, report n° 3, June 2010, p. 25.
Want a job? Tell me where you come from…
Another aspect of this discrimination is obviously related to hiring. Does everyone looking for a job receive an equal treatment when he or she sends his or her CV to an employer? The Human Rights and Youth Rights Commission led an inquiry which shows that it is unfortunately not the case. A person looking for work has much more chances of being called for a job interview if the name which appears on the CV sounds like a French Canadian name.
Treatment observed vs. tested organization status
| Treatment |
Employer legal status |
||
|
Private |
Public |
Non-profit |
|
| a. None of the candidates are short-listed |
267 |
39 |
35 |
| b. Only the candidate from the majority is short-listed |
90 |
5 |
14 |
| c. Only the candidate from the minority is short-listed |
18 |
5 |
3 |
| d. Both candidates are short-listed |
83 |
8 |
14 |
| e. TOTAL |
458 (100%) |
57 (100%) |
66 (100%) |
| f. Net discrimination ratio |
37,7% |
0% |
35,5% |
| g. Short-listing ratio for the candidate from the majority |
37,8% |
22,8% |
42,4% |
| h. Short-listing ratio for the candidate from the minority |
22,1% |
22,8% |
25,8% |
| Ratio (g/h) |
1,71 |
1,0 |
1,64 |
Source: Paul Eid, Mesurer la discrimination à l’embauche subie par les minorités racisées : résultats d’un "testing" mené dans le grand Montréal, Commission des droits de la personne et des droits de la jeunesse, 2012.
As shown in the above graph, job discrimination persists both in the private sector and in non-profit organizations. Disturbingly, only public services appeared until now to resist this tendency towards systematic discrimination. Unfortunately, the establishment of the Charter poses serious risks regarding the integration of immigrant women into the labour market. Furthermore, it is likely to reintroduce into the public sector more or less explicit forms of discrimination precisely where Québec had begun having some success in the struggle to bring an end to discrimination.
This article was written by Philippe Hurteau, a researcher with IRIS—a Montreal-based progressive think tank.


