Since management of Canada’s energy resources has become a major economic issue in this election, I thought it would be useful to review how Norway and Canada—both major producers and exporters of petroleum (oil and gas)—go about it. Spoiler alert: Norway manages its energy resources much better than we do.
A glimpse at the major differences in approach shows us why. Keep reading for more detailed analysis.
Production
Both Canada and Norway produce roughly the same volumes of oil and gas. Norway is the worlds 6th largest exporter of oil and the 2nd largest exporter of gas. It exports 90% of its oil production, and 90% of that goes to EU countries.
Canada is the 9th largest oil exporter and 4th largest gas exporter. It exports almost two-thirds of its production, and virtually all of that to the U.S. Canada is also a major importer of oil—equivalent to 55% of its exports.
Ownership
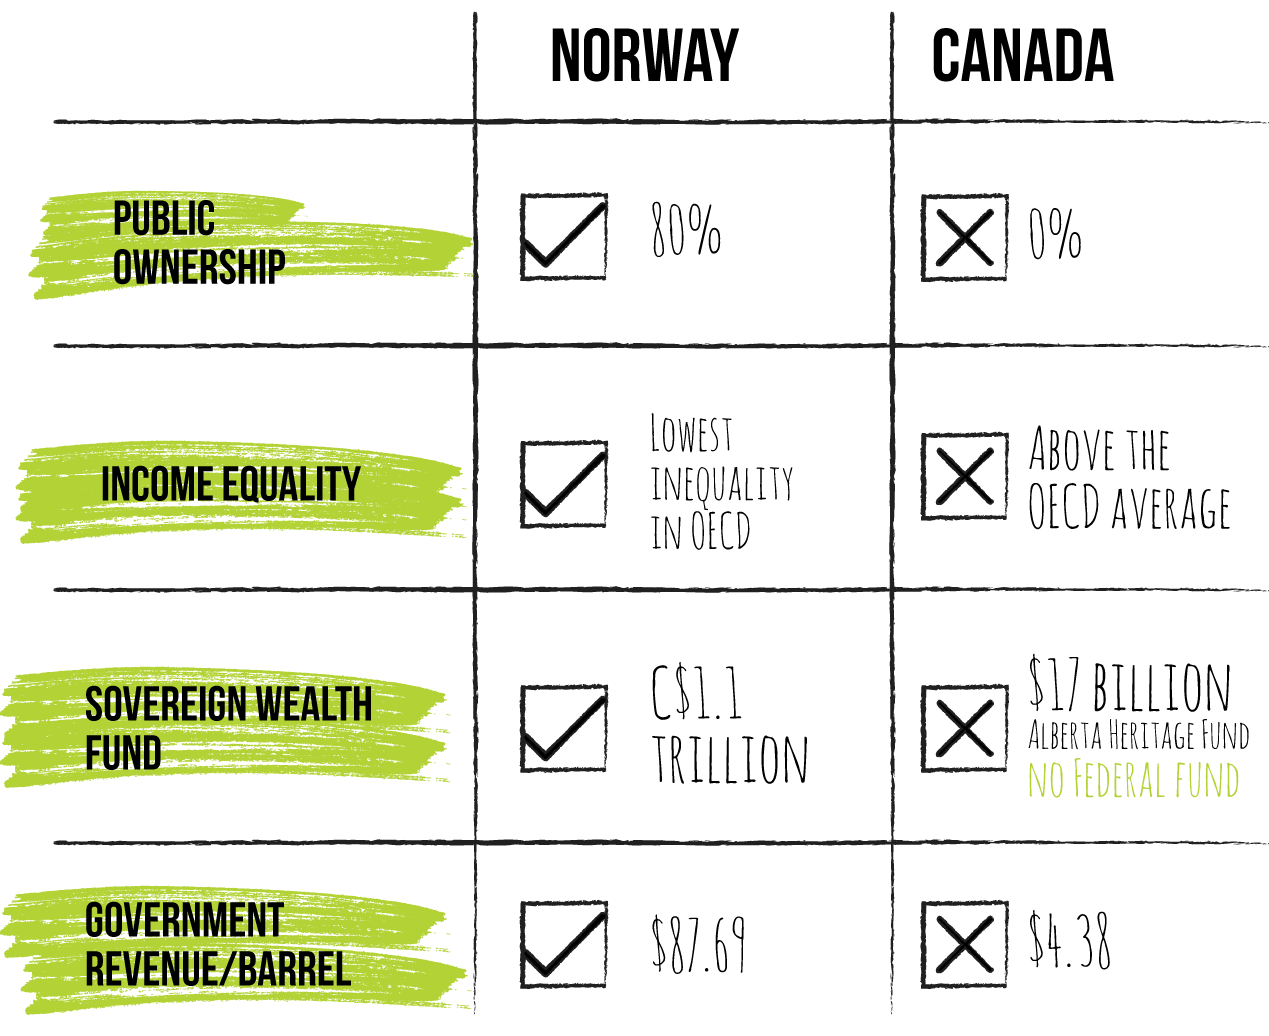
The Norwegian state owns 80% of its petroleum production and transportation infrastructure.
In Canada, petroleum production and transportation infrastructure is 100% owned by foreign and domestic private companies as well as foreign state-owned companies, including from China, France, Korea, Malaysia and Norway and Thailand. Publicly owned Canadian companies—Petro-Canada and Alberta Energy Corporation—were fully privatized in the 1980s and 1990s.
Non-petroleum taxation
From the outset, Norway maintained high non-petroleum taxes despite rising oil revenues. Its tax-to-GDP ratio (currently 42%) is among the highest in the OECD.
Alberta lowered its non-petroleum taxes as petroleum revenues rose, to the point where it now has by far the lowest overall taxes in Canada. This put pressure on other provinces to lower their taxes as well. Canada’s tax-to-GDP ratio fell from 36% in 1998 to 31% in 2013—representing a massive cut to governments’ fiscal capacity.
Taxation of petroleum companies
Since the mid-1990s, the Norwegian tax rate on petroleum company profits has been 78%.
Both the Canadian and Alberta government lowered general corporate income taxes, including on petroleum companies, over the last 15 years. Since 2000, the federal rate was cut from 28% to 15%. Net of subsidies, the effective federal tax on petroleum companies is about 7%. The Alberta corporate income tax rate was cut from 15.5% to 10% between 2001 and 2014.
Capturing the petro-surplus
The Norwegian government captures an estimated 85% of the petroleum economic surplus, mainly through high taxes on producers and directly through the state corporation, SDFI.
The petro-surplus captured by the Alberta government (mainly through its royalty system) is among the lowest of all petroleum producing jurisdictions.
Norway realized revenues of $87.69 per barrel of oil in 2013 while Alberta took in only $4.38 per barrel— one-twentieth what Norway appropriated. The Canadian government captures a very small portion of this surplus through its 15% federal corporate tax rate.
Distribution of the petroleum surplus
Petroleum wealth is equitably distributed giving Norway one of the lowest levels of income inequality in the world. It also has one of the most generous social welfare systems.
Since the mid-1990s income inequality in Canada has grown rapidly, driven by the richest 1%. It is now above the OECD average. Social programs have been cut. Interprovincial income disparities have grown. Reduced federal-provincial transfers have exacerbated these disparities. Income inequality within Alberta is the highest in Canada.
Saving a portion of the petroleum surplus: Sovereign wealth funds
Norway set up a sovereign wealth fund in 1990 to save a portion of its petroleum revenues for the benefit of current and future generations. It now holds C$1.1 trillion, making it the world’s largest sovereign wealth fund.
Alberta established its Heritage Savings Fund in 1976, but it contains only $17 billion. The federal government has no sovereign wealth fund and no plans to establish one.
Fiscal management
The Norwegian government’s fiscal capacity is cushioned from price swings and fluctuating petroleum revenues due largely to its petroleum wealth fund. All petro-revenues are placed in the Fund then invested abroad. Only the return on Fund investments—4% long term—is remitted to government coffers. The government can take a higher percentage to cover a larger than anticipated revenue shortfall, ensuring that the budget is always balanced.
The Alberta government is highly dependent on petroleum revenues for current expenditures, which go up and down as oil prices fluctuate. Its practice has been to cut spending during downswings, exacerbating the negative effect on the economy. Alberta’s small sovereign wealth fund is not able to cushion the impacts of falling petro-revenue in the same way as Norway. This year, the Alberta government’s deficit is estimated to be $6 billion.
The federal government’s budget has been in deficit since 2008 and only achieved marginal surplus 2014-15 thanks to massive cuts in public services. By cutting non-petroleum taxes, the government has become more dependent on petroleum and other resource revenue. The oil price collapse has almost certainly pushed the federal budget back into deficit.
Exchange rate management
Norway has maintained a stable exchange rate with its main trading partner, the EU, due largely to its sovereign wealth fund’s ability to manage inflows and outflows of petroleum revenue.
In Canada, the petro-led resource boom caused a dramatic rise in the Canadian dollar—from 62 cents U.S. in January 2002 to parity in 2007—with major adverse impacts on non-petroleum regions of Canada, as reported by the OECD. Since the 2014 oil price collapse, the dollar has fallen to 75 cents U.S.
Trade
Norway has maintained a huge trade surplus since the mid-1990s.
Since the 2008 recession, Canada’s overall goods and services trade has been in deficit. Its non-energy goods trade deficit is massive. The oil-led resource boom resulted in a dramatic shift in the composition of Canada’s trade, with unprocessed and semi-processed resource exports now accounting for almost two-thirds of Canada's total goods exports. High-value-added finished products have dropped to one-third of exports from almost 60% in 1999.
Unemployment
Norway has maintained virtually full employment (4% or less) since the global economic meltdown and thus far into the 2015 despite the oil price collapse.
Canada’s unemployment rate has remained high since 2008 (currently around 7%). While Alberta’s unemployment rate has been lower, it jumped from an average of 5.4% from 2009-2014 to 6% currently.
Bruce Campbell is the executive director of the CCPA. He travelled to Norway to better understand the “Norwegian Model” and summarized his findings in the 2013 CCPA report The Petro-Path Not Taken.