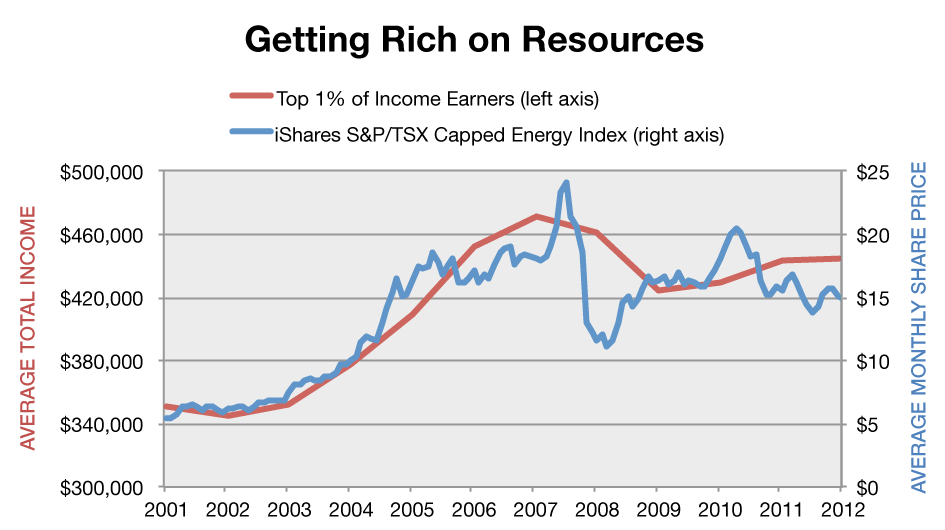
Editor's note: An earlier version of this post included a graph that inadvertently made use of misleading historical stock market data. It has since been corrected and the author apologies for the error.
Statistics Canada surprised a lot of observers last week when it declared that income inequality in Canada is on the way down.
According to their newly published figures, the share of incomes going to the top 1% of income earners in Canada declined from 12.1% to 10.3% between 2006 and 2012. It is the first prolonged period since 1982 where the bottom 99% of income earners in Canada actually gained any ground on the very wealthy.
There is definitely some good news here. Median incomes of the bottom 99% in Canada rose nearly 5% between 2006 and 2012—from $28,900 to $30,300. After a dismal few decades, median incomes for the majority of Canadians are now 3.6% higher than they were in 1982 (adjusted for inflation). The bottom 99% have nothing on the top 1%, whose median incomes rose nearly 50% between 1982 and 2012—soaring from $200,100 to $299,000—but at least it’s a positive change from perennial wage stagnation.
The bad news is that the slight overall drop in inequality in the past six years has much more to do with the volatility of Canada’s resource sector than to any structural changes in the Canadian economy. To put it simply, falling commodity prices have disproportionately affected the wealthy, which has exaggerated the appearance of narrowing inequality.
Top incomes in Canada track the stock market in general, but the relationship between top incomes and Canadian energy stocks is especially clear—in statistical terms, the correlation between average incomes of the top 1% and the average annual performance of energy equities in Canada is 0.98 out of 1 over the past ten years for which we have data. When the energy sector struggles, top incomes take a hit. And when the wealthy lose income, income inequality drops too.
Unadjusted for inflation. Sources: CANSIM 204-0001 and Yahoo Finance
Top incomes have dropped in most provinces since 2006, but it's the Western resource provinces where top incomes—and income inequality—have dropped the most. The share of incomes going to the top 1% of Albertans declined 27% between 2006 and 2012, compared to 15% nationally. The runners up? Saskatchewan and British Columbia. Every other province experienced declines in inequality below the national average, presumably due to proportionately smaller reliance on the energy sector.
The relationship between stock performance and the income share of the top 1% also holds in the US. Inequality south of the border increased significantly between 2006 and 2012, which tracks the US stock market very closely (correlation of 0.84 out of 1). Whereas commodity prices dipped in 2011, pulling inequality in Canada down, the Dow Jones experienced big gains, which widened the gap between the rich and the rest in the US.
Bottom line: the real story from last week’s Stats Can report isn’t that Canada is turning the tide on inequality, but that the energy sector is a key driver of income inequality in Canada. Massive investment in the oil sands has benefited the wealthiest earners to the exclusion of most other Canadians, and those immense gains have simply been reduced from their 2006 high.
The long-term trend in Canada is still towards greater inequality, as a new TD Bank report explains (PDF), and Alberta is still the most unequal province, which is exacerbated by new oil sands investments.
In other words, what’s good for the energy sector is good for Canada’s wealthy—and vice versa. However, no strong connection exists with the incomes of the bottom 99% of Canadian, even in cities like Calgary. Does that really justify such incredible investment in the oil sands? It’s a debate we should be having.
Hadrian Mertins-Kirkwood is the CCPA's 2014 Andrew Jackson Progressive Economics Intern and a researcher on the CCPA's Trade and Investment Research Project. Follow Hadrian on Twitter @hadrianmk.


