
It’s no secret that university and college revenues are shifting, with the public component of funding largely in decline.
It’s also no secret—or coincidence—that the tuition and other fees charged to students are up. In most cases, way up. After all, the money has to come from somewhere. And as a result, this is what university and college revenues—consisting of public (i.e. government) money and tuition fees—in Ontario look like over the past 15 years. [1][2]
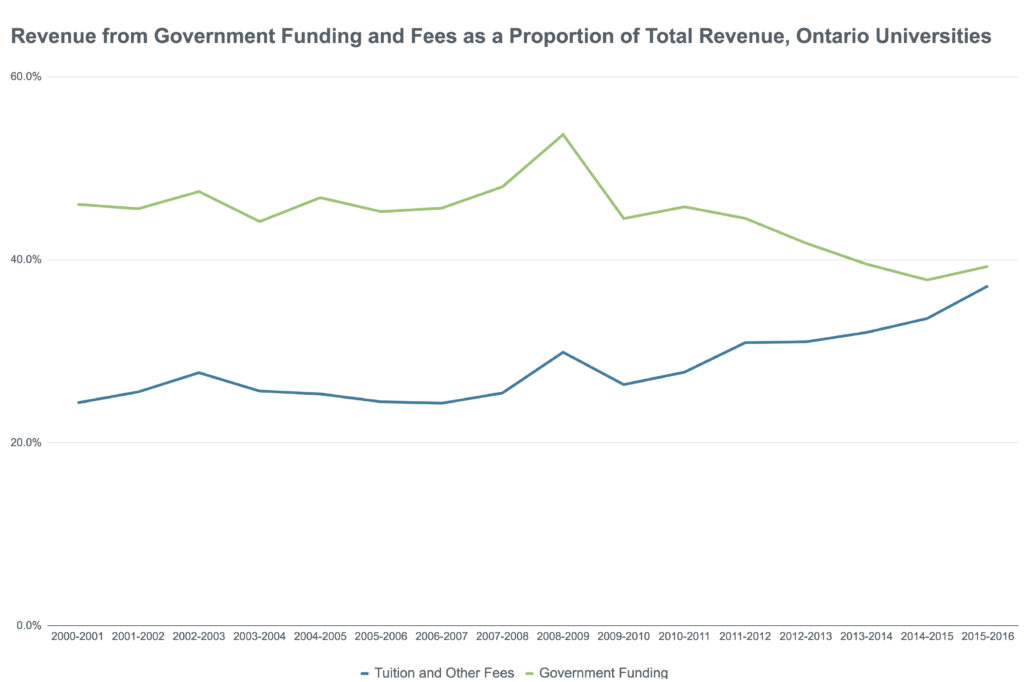
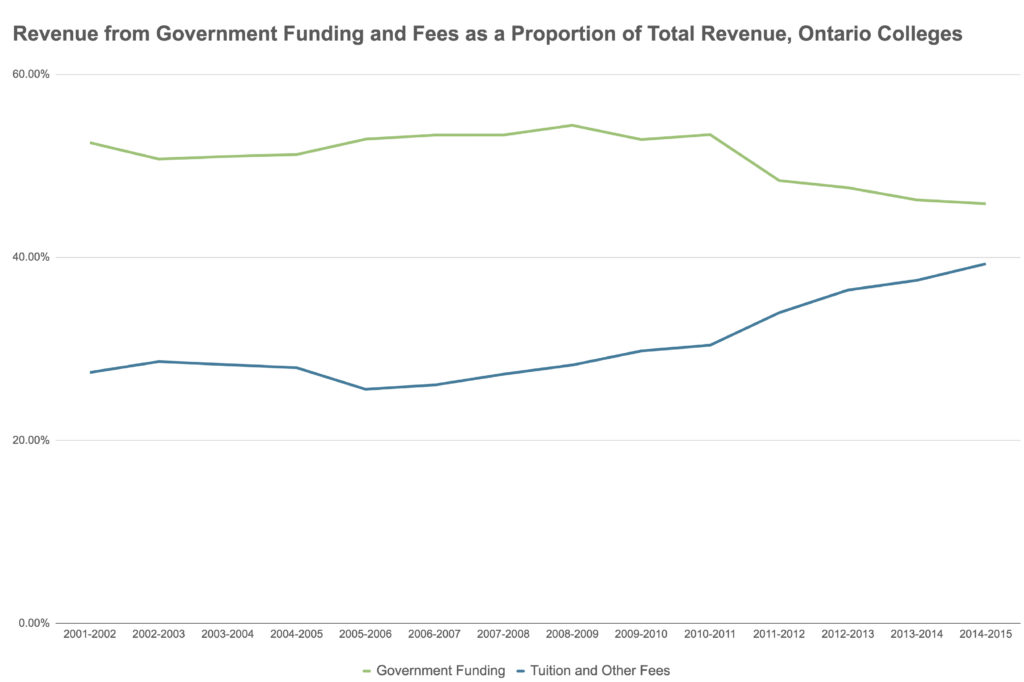
We know that, in Ontario, university students contributed more through total tuition (52.4%) than government (39.3%) towards university operating revenue in 2015.[3] College students contributed 41% in total tuition to operating income (44% of college operating revenue comes from government funding). As it stands, Ontario students are contributing more to their postsecondary institutions operating revenues than students in any other province or territory.
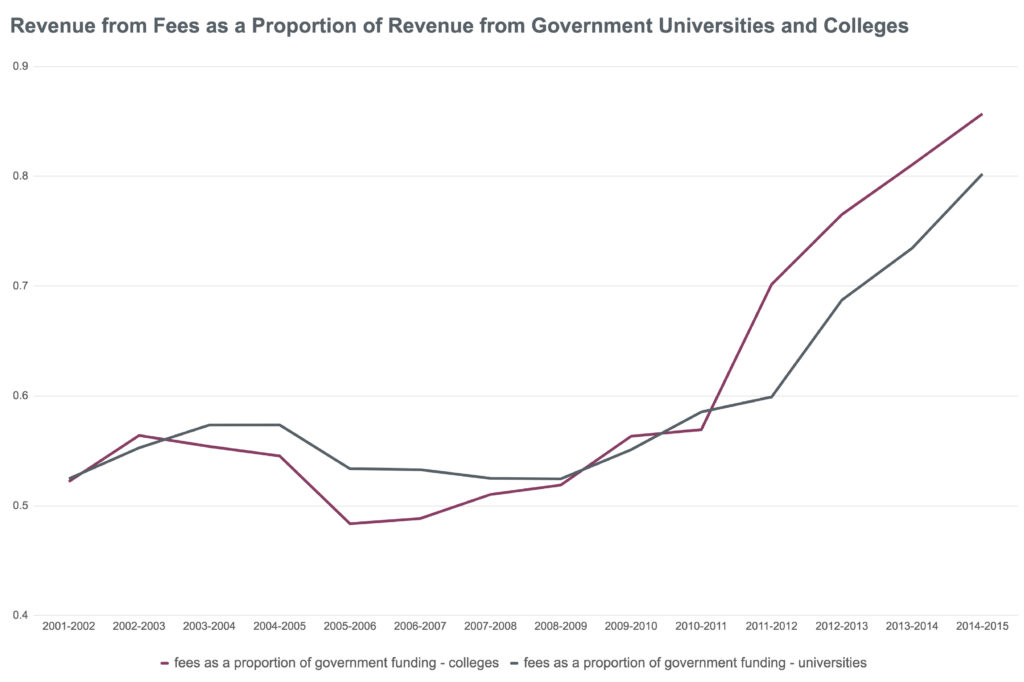
The back-to-school season provides an annual opportunity to examine the degree to which governments prioritize post-secondary education funding, and the extent to which financial responsibility has been downloaded to students and their families through rising tuition fees. As the chart below shows, in 2014-2015, for every dollar of government revenue received by colleges, students paid $0.86 in fees.[4] Likewise, in 2015-2016, universities received $0.94 from student fees for each dollar they received from government sources.
This fall, debates over adequate wages and improving working conditions through Bill 148 and a $15 minimum wage encourage us to look at university and college campuses in a different light: as places of work as well as places of learning, and to consider the quality of jobs provided for all workers at these institutions. This leads us to ask: as sources of funding change from public to private, have working conditions on campuses changed as well?
In the higher education sector, money spent on workers’ salaries and benefits make up the biggest percentage of university and college expenditures. This shouldn’t be surprising: a large and diverse workforce is responsible for all aspects of the day-to-day operations of these institutions, from the facilitation of teaching, learning, and research to maintaining the conditions in which these activities take place.
So what do the numbers suggest?
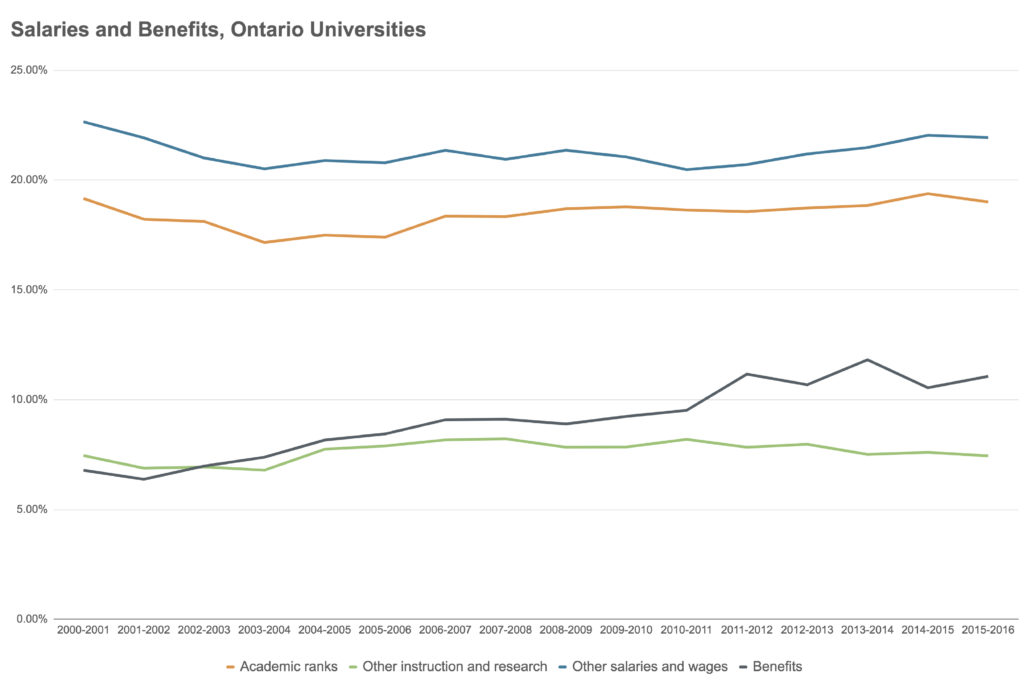
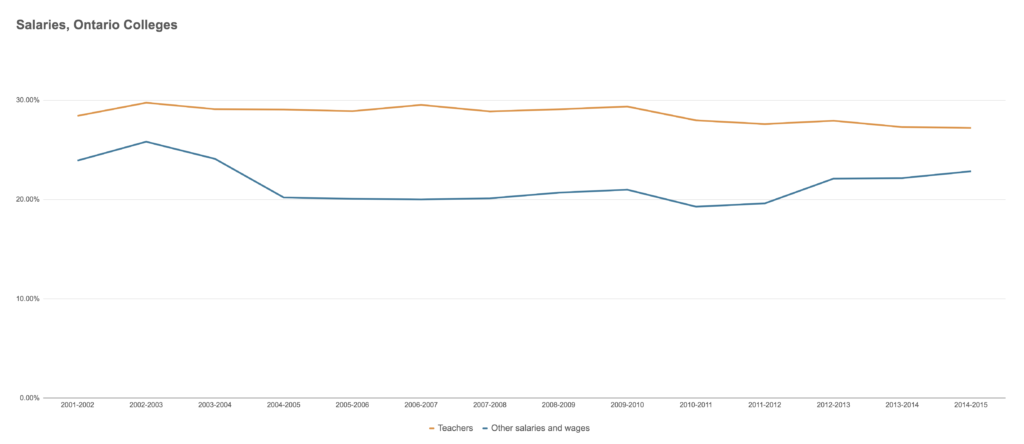
At first glance, the percentage of expenditures on wages and benefits over the past 15 years has been relatively consistent. But how does this play out for workers across the sector?
Over the years, high paid university and college administrators, as well as some professors, have appeared prominently on the Public Sector Salary Disclosure site (often used as a distraction to fuel populist—though misplaced and even inaccurate—outrage at public sector workers more generally). However, not all workers or faculty on university and college campuses are as well compensated—within, as well as between, job categories. Who and how many are paid less fairly is a matter that requires closer analysis.
Significant disparities exist in job security, working conditions, benefits, and quality of work life between tenure-stream professors and contract faculty. Attention has recently been drawn to this discrepancy through research, collective bargaining campaigns, organizing drives, and well-timed awareness-raising campaigns, both in Canada and internationally. These actions are more than worthwhile; they are necessary.
But the higher education sector is multifaceted, representing a wide range of different types of jobs, different categories within job descriptions, and in some cases (often as a result of contracting-out) different employers. That means the analysis needs to extend beyond the classroom and lecture halls to other aspects of university and college infrastructure, including physical maintenance, security, parking, libraries and food services. Many of these workers are experiencing low pay and irregular hours— earmarks of precarious employment.
Universities and colleges represent a huge workforce. As such, they are in a position to lead by example when it comes to working towards and ensuring fair pay and good working conditions for all employees. Pay equity is one such area, and a number of universities (recently, McMaster, Laurier, Waterloo, and UBC) have responded to the gender wage gap by raising the salaries of female professors (though not, incidentally, of non-professors at their respective universities).
This is laudable, in an “it’s about time” kind of way.
The Fight for $15 and Fairness campaign has provided an additional dimension to the debate. Recent food service worker strikes at York University and the University of Toronto Scarborough won a $15 starting wage and equal benefits for full-time and part-time workers and, this fall, service workers at the University of Toronto won a $15 minimum wage for casual workers.
However, especially in the context of current debates about an increased minimum wage and better working conditions both on and off campus, there’s no question more needs to be done. That’s why we are digging into the available data to map the rise and determine the extent of precarity for a broad cross-section of workers—not just teaching staff— on university and college campuses in Ontario.
How does precarity impact job security, wages, and the quality of the workplace? What are the human implications of postsecondary institutions internalizing and reinforcing low-wage, precarious employment strategies? And finally, what mechanisms can be put in place to ensure that university and college workers—regardless of their department, their job, or category of employment—have a secure job that affords them a decent quality of life?
We’re excited to see what the research uncovers. Stay tuned.
Erika Shaker is Director of Education and Outreach with the CCPA. Follow her on Twitter @ErikaShaker.
[1] Revenue from Government Funding and Fees as Proportion of Total Revenue, Ontario Universities source: CANSIM 477-0058
[2] Revenue from Government Funding and Fees as Proportion of Total Revenue, Ontario Colleges source: CANSIM 477-0060
[3] This data is from the 2016 CAUT Almanac (https://www.caut.ca/resources/almanac/finance)
[4] Data for charts are sourced from Statistics Canada CANSIM tables 477-0058, 477-0059, 477-0060, and 477-006.