Heading into Ontario’s June 7 election, the three major political parties have made distinct expenditure promises and revenue announcements. Let’s look at these fiscal plans in historical and comparative context (see note 1).
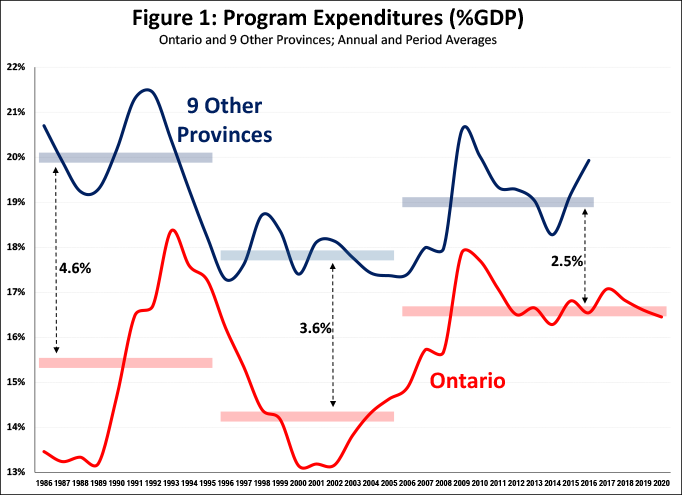
Ontario governments have traditionally supplied a comparatively low level of public services (e.g., health, education, etc.) and cash transfers as measured by program expenditures. Figure 1 shows that program expenditures as a percentage of GDP in Ontario have been lower than the average of the nine other provinces over three decades (program expenditures are total government expenditures minus interest on debt).
While Ontario has slowly been narrowing the program expenditure gap with other provinces, base program expenditure projections for 2018–20 show that policy changes will be necessary if Ontario wishes to continue closing it.
Likewise, Ontario governments have traditionally collected a comparatively low level of revenues. We can see this in Figure 2, which shows that the province’s own-source revenues (total revenues minus federal transfers) for the same period (2018–20) are comparatively lower than in the other provinces.
In contrast to program expenditures, however, Ontario has not been closing the own-source revenue gap with other provinces. For that to happen, policies need to change.
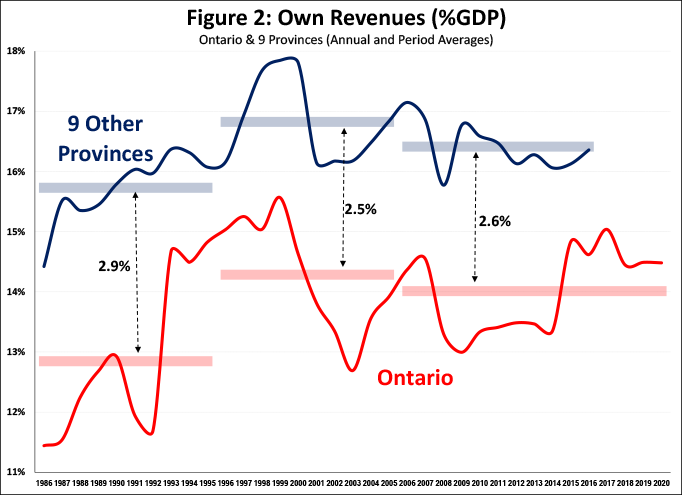
Since 2003, consecutive Liberal governments in Ontario have increased program expenditures in contrast to their Progressive Conservative predecessors, who reduced them significantly over their eight years in government (on average by 0.4% of GDP per year). However, the Liberals did not correspondingly increase own-source revenues, which, combined with the 2008-09 recession, contributed to a series of deficits and a faster increase in the provincial debt compared to the other provinces.
On the eve of the 2018 election, Ontario faces a fundamental imbalance between expenditures and revenues. Economic growth alone cannot balance this type of structural deficit; fiscal policy changes are required.
Comparing the plans
This brings us to the fiscal plans of the three major political parties, which are always challenging to analyze. The inherent risk of any economic forecasting is compounded by the fact that fiscal plans are ultimately political promises subject to varying levels of transparency and comprehensiveness, not to mention party credibility. Further, there is no requirement for parties to issue fiscal plans, nor any agreed-upon template for them.
There are a number of approaches to address the latter challenge, depending on objectives. My aim is to compare the direction and order-of-magnitude change in fiscal policy from a historical and comparative perspective. Therefore, my focus is not on specific programs or revenue sources on the one hand, nor total revenues and expenditures (or deficits) on the other. Rather, I look at own-source revenues and program expenditures, because these are the actual fiscal policy levers available to provincial governments in the short and medium term.
That is why my analysis does not include federal transfers, which are outside provincial jurisdiction, or interest on debt, which is mostly driven by past debt rather than currently incurred debt.
First, I establish a base of program expenditures and own-source revenues to 2020-21 (referred to as 2020), calculated according to the medium-term budget outlook of the Fiscal Accountability Office (FAO) released on May 2, 2018. I then exclude the program expenditure/own-source revenue changes from the Liberal government’s 2018 budget issued in late March, as identified by the FAO.
The resulting 2020 base program expenditures would be $154 billion and own-source revenues would be $135 billion (all numbers rounded to nearest billion). As an aside, this FAO base adopts the auditor general’s representation of program expenditures (including from the Fair Hydro Plan) rather than the lower estimates from the Liberal government.
To this base I overlay the three different fiscal plan changes from their respective baselines, summarized in Table 1.
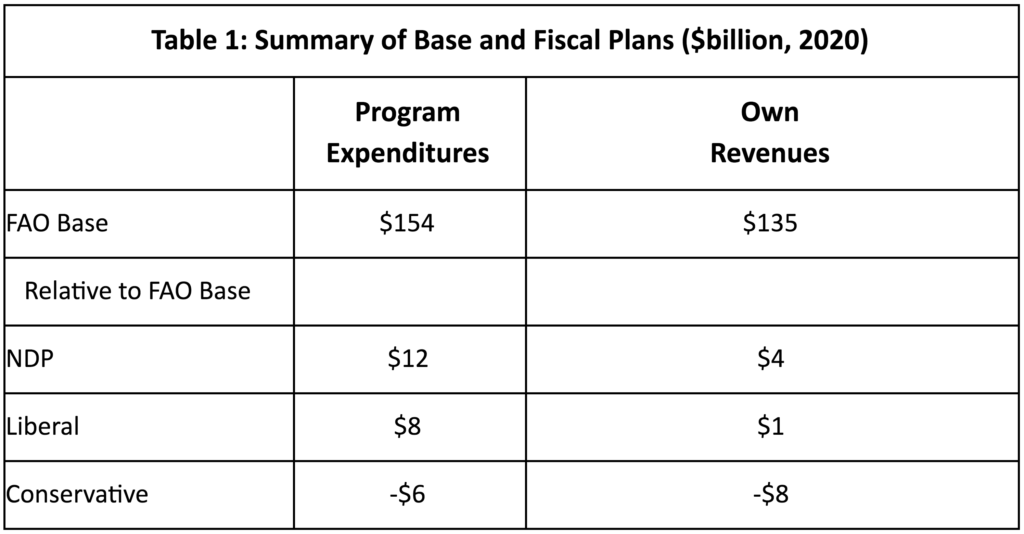
NDP: The NDP included a comprehensive, standalone fiscal plan in the platform it released this April. Relative to its baseline, they would increase program expenditures by about $12 billion and own-source revenues by about $4 billion by 2020. I apply these changes to the FAO base.
Liberals: For most of the election the Liberal party has been campaigning (see note 2) on the program expenditure and own-source revenue changes announced in the 2018 provincial budget, which, according to the FAO’s baseline, would increase program expenditures by about $8 billion and own-source revenues by about $1 billion relative to base. I apply these changes to the FAO base.
PCs: As of May 28, the PC party had not issued a current comprehensive fiscal plan. Instead, PC leader Doug Ford has been making a series of ad hoc announcements, including a promise to reduce program expenditures by 4% via “efficiencies.” I estimate that program expenditures would decrease by about $6 billion and own-source revenues would be reduced by about $8 billion (see note 3). I apply these estimates to the FAO base. Program expenditure decreases would be about 0.4% of GDP a year, similar to those of previous PC governments.
Conclusion
Over the last three decades, Ontario’s program expenditures and own-source revenues have been low compared to other provinces. In this context, the 2018 Ontario election offers voters three distinct fiscal visions.
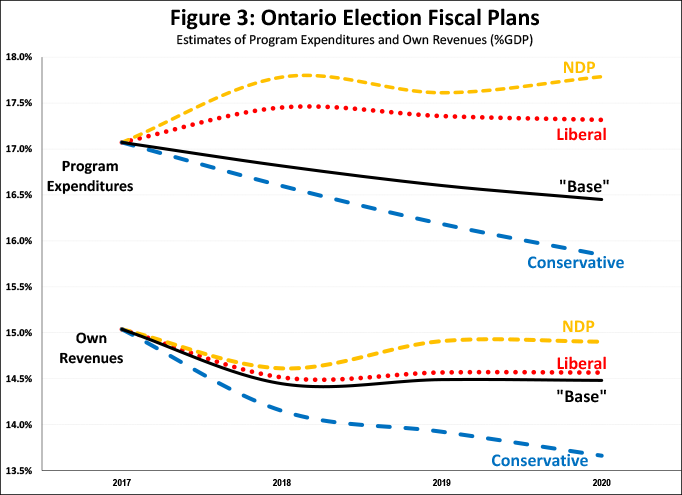
The NDP, and to a lesser extent the Liberals, would increase program expenditures relative to GDP and continue to slowly close Ontario’s program expenditures gap with other provinces.
The Liberals would increase own-source revenues very slightly relative to base, but that increase would not keep up with economic growth and therefore reduce it relative to GDP. That would widen the program expenditures gap with other provinces.
The NDP would increase own-source revenues more substantially but also stable relative to GDP, therefore neither closing nor increasing the own-source revenues gap with the other provinces.
By reducing program expenditures and own-source revenues relative to base and to GDP, the PCs would widen the gap in both program expenditures and own-source revenues compared to other provinces.
In closing, while each of the fiscal plans provide a different mix and direction of fiscal policy, it is also true that all three of the parties would maintain Ontario’s low program expenditures and own-source revenues compared to other provinces, at least during their first term.
Edgardo Sepulveda is an independent consulting economist who writes about electricity, fiscal policy, inequality and other economic policy issues at the Progressive Economics Forum.
Notes:
- In a separate companion post I estimate the impact of these fiscal plans on income inequality: http://www.progressive-economics.ca/2018/05/28/inequality_and_ontario_fiscal_plans/
- The Liberal Party released their platform on May 26, including a “Fiscal Recovery Plan” that included fiscal balance estimates that are identical to those included in the 2018 budget. Based on this, I conclude that, for the purposes of this article, the Liberal platform is no different than the budget.
- A number of journalists and analysts are keeping unofficial track of PC announcements, including https://medium.com/@MikePMoffatt/ontario-election-deficit-revenue-expense-estimator-356a02c850f7. I use these (as of May 24) revenue changes (-$7.6 billion). To the costed expenditure changes (as of May 24) ($0.5 billion) I add the above-noted $6 billion decrease, for a net of -$5.5 billion (rounded to $6 billion in the text). The PC leader has also committed to balance the budget in his first term. Given these reductions in own-source revenues, reductions in the order of $6 billion (and more) would be required in program expenditures to be able to move toward a balanced budget. Given this context, I conclude that, on the whole, the inclusion of the $6 billion is appropriate.