History is clear: The Harper government's record on job creation is the weakest of Canada's past nine prime ministers.
But is it the best job creation record we could have right now, given how so many nations are struggling with the enduring impact of the 2008 global economic crisis? When it comes to recovery, are we the best in show in the G7? That depends on what you measure.
Among G7 countries, Canada can boast the biggest growth in the labour market (job seekers and workers) and the second biggest growth in the number of jobs (the U.S. has done better) since the recovery began in 2009. We fall in the middle of the pack when it comes to growth in the employment rate (that compares growth in the number of jobs to growth in the working age population).
Our performance also looks better if you start the clock from the depth of the recession, in July 2009, rather than before the recession hit. Even so, conditions have soured over the past year, partly because of economic turbulence in China (which was the biggest horse pulling our cart early in our recovery), partly because the U.S. economy has picked up speed, but importing less from Canada than expected. The global economy, and Canada's, continues to have its growth outlook downgraded.
How has recovery affected full- and part-time employment?
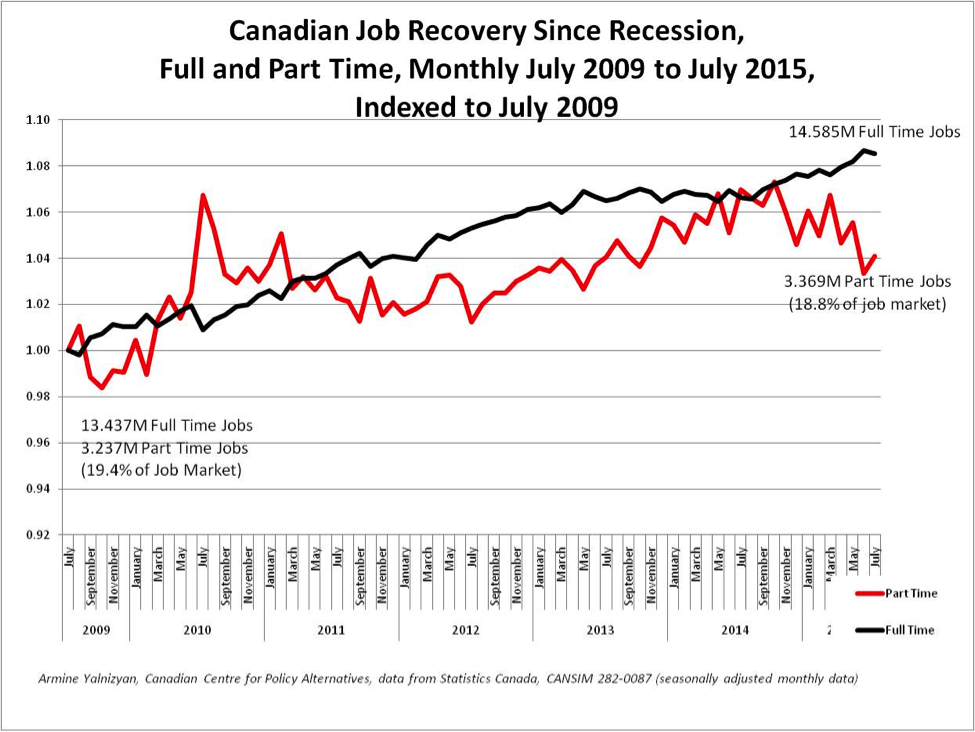
The following chart shows the job creation track record, full and part time, for Canada, indexed to July 2009, when our economy stopped contracting and started growing again.

The recovery has been propelled by full-time job growth since early 2011, but the overall pace of job creation (full- and part-time) is slowing down, and may stumble further if the mild recession we are in the midst of doesn't slip away soon.
Between 2013 and 2014, the Canadian job market added about 110,000 full- and part-time jobs. However, in 2014, we also saw the addition to the labour market of 165,000 economic immigrants and 292,000 workers with temporary work permits (see graph here).
Since the depths of the recession, over a million full-time jobs were added to the Canadian labour market (an 8.5% increase between July 2009 and July 2015), and 132,000 part-time ones (a 4% increase).
While a healthy 255,000 full-time jobs have been added to the mix over the past year, 94,000 part-time jobs disappeared, reversing gains made since late 2013.
Where are the jobs being generated?
We often think the west propelled our jobs recovery, but Ontario produced the largest share of new jobs since 2009 (44% of them). That has been particularly true over the past year, when it accounted for 55% of Canada's new full-time jobs, well beyond its share of the job market.
It's true that for most of the recovery, Alberta has punched above its weight, contributing 23% of all net new full-time jobs. Over the past year, however, it's only been responsible for 9% of full-time job growth, less than its share of Canada's full-time jobs (13%) because of plunging oil and gas prices.
Some provinces haven't seen any growth in full-time jobs since th recovery began (New Brunswick, Nova Scotia and Prince Edward Island). Some have seen a drop in full-time jobs over the past year (PEI and Saskatchewan, (1% and 4% respectively).
Then there's part time employment. Quebec accounted for 55% of the growth in part-time employment since 2009. Over the past year, Ontario alone accounted for two-thirds of the nation's losses in part-time jobs. Only Saskatchewan has added more part-time positions to the mix in the past year, but not at a scale that could offset the headcount of lost full-time jobs. (PEI also registered growth in part-time work, but the job count was at a scale that could be a rounding error.)
Who's getting the work in this recovery?
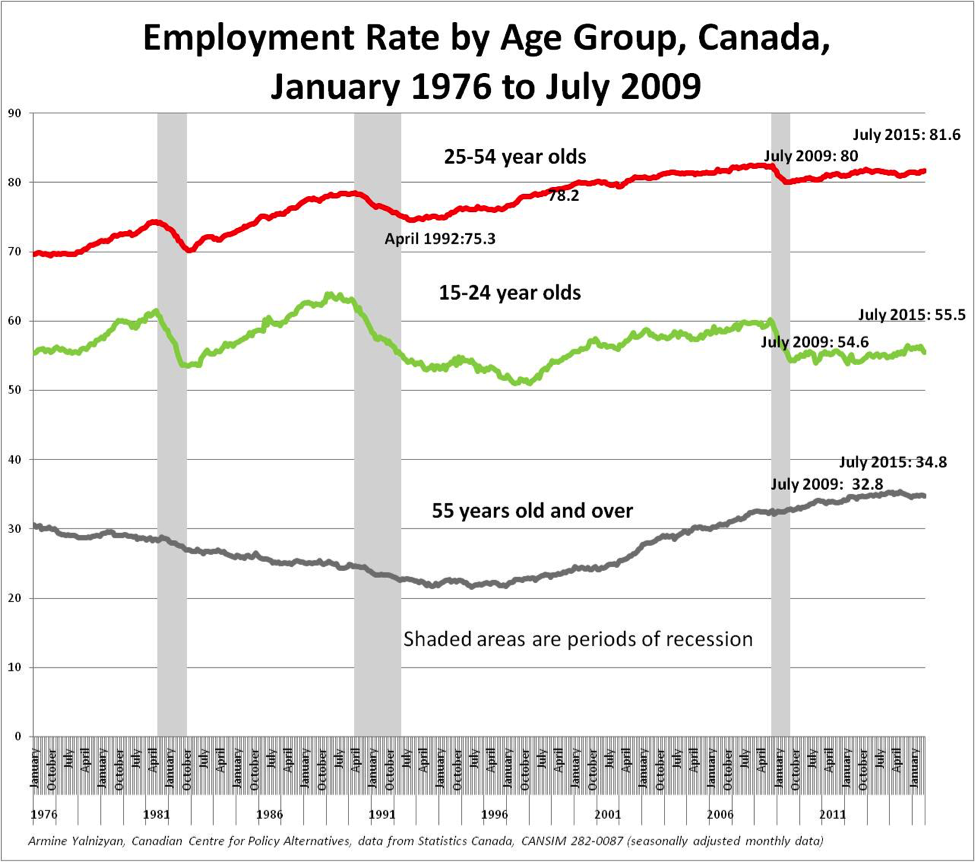
If you look at the proportion of people working by age group, this job recovery has been skewed toward Canadians aged 55 and over. Young people have seen almost no increase in their employment rate and, as you're about to read, the quality of those jobs has deteriorated. This is all the more striking because the young population (aged 15-24) did not grow, while the population of those aged 55 and over has grown by 22% since 2009.

While there was a bigger, more prolonged drop in the employment rate of young workers in the wake of the 1990–1992 recession, today's young workers started off from a lower level and have, as yet, not seen any "recovery." Between 2008 and 2012, almost 30,000 people aged 15-24 wanted work but were not in the labour force and had returned to school; but this number has been falling off and has now returned to 2005 levels. We cannot compare these trends to what happened in the 1990s due to data limitations. We can only hope these investments in human capital will ultimately pay off, for the students and for society.
But, thus far, this recovery has been notable in its absence of job growth and steady job opportunities for young people. Between October 2008 and July 2009, young workers lost 185,000 full-time and 32,000 part-time jobs. Since then, they have recovered only 15,000 full-time jobs, though the number of part-time jobs is almost back to pre-recession levels. However, over the course of the past year, they lost 31,000 part-time jobs and added almost no new full-time jobs.
Why are today's young workers so much worse off?
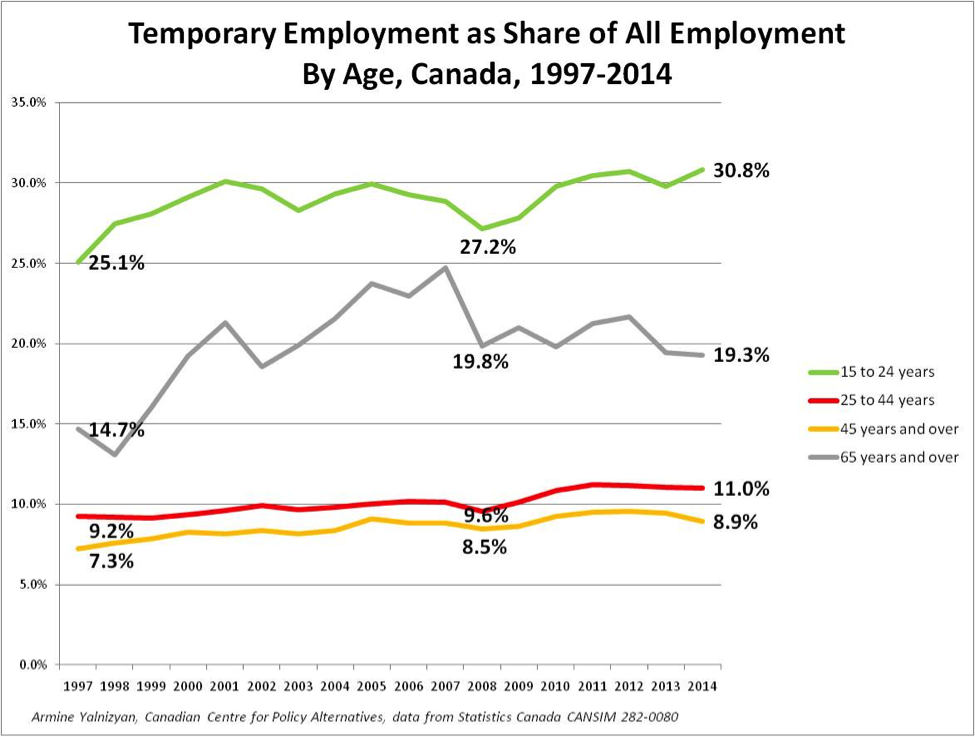
The primary source of employment for young workers has been in temporary forms of work (contract, seasonal, casual). Between 2008 and 2014, about half a million permanent jobs were added to the economy (466,000). In that time frame, workers aged 15-24 saw the loss of 181,000 permanent jobs.

Are wages stagnating?
There has been much debate as to whether people are better off despite the recession. Much of the debate is a confusion of whether we are talking about wages or earnings.
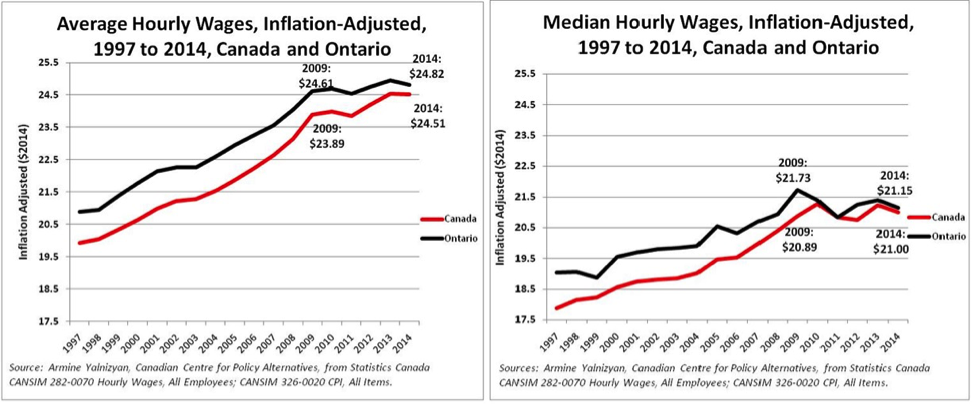
Average hourly wages, adjusted for inflation, were indeed improving right through the recession until about a year ago. Average wages include hourly pay rates of employees who are managers and executives. Since 2013, average wages have flattened out. This is likely because the majority of workers, but not all of them, have been losing ground.
Median hourly wages (which represent workers' pay rates in the middle of the wage distribution) were hovering around the 2009 level for Canada in 2014, and were lower than in 2009 in Ontario. This downward trend in median hourly pay rates has continued in the first part of 2015, adjusting for inflation. This means at least half the Canadian workforce is experiencing a reduction in rates of pay, possibly attributable to the recent reduction of work in high-paying sectors of the economy such as oil and gas and other resource extraction activities.
It is important to make the distinction between weekly earnings (which conflates work effort with pay rates) and hourly wages (the value of work to the employer). Hourly wages become even more important when a growing contingent of young workers don't have a steady job. They presage the "new normal" in the labour market—the on-demand workforce, the latest version of just-in-time labour, which pays you for only the hours you work, and doesn't guarantee how many hours you'll work.
Globally this recession has proved difficult to shake. Canada's economy benefitted from being far better endowed with natural resources than other G7 nations, permitting us to ride the coattails of resource-gobbling giants like China for most of the recovery period. Those days are over.
Slow growth is on the menu for as far as the eye can see. If it goes on much longer it will collide with population aging, which will usher in an era of prolonged slowth.
It's not enough for Harper to boast about his record, or his opponents to fret about it. Job creation is important, but the rise of temporary work and multiple jobs in a year means counting heads isn't enough. The job situation is tenuous, even more so for our kids. What's the plan to deal with that?
Armine Yalnizyan is a senior economist at the Canadian Centre for Policy Alternatives, and business columnist for CBC Radio’s Metro Morning. You can follow her on Twitter @ArmineYalnizyan.


