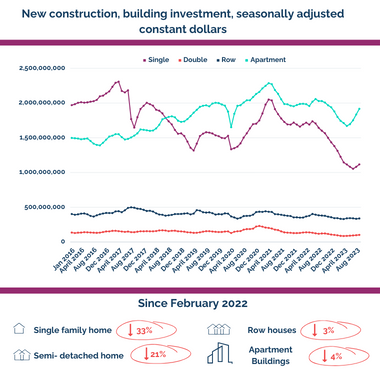
New construction, building investment, seasonally adjusted constant dollars
By David Macdonald, CCPA National Office
One of the unspoken truths of much higher interest rates is that it cools economic growth by slowing new home construction. At a time when governments at all levels are pushing hard for more houses to be built, the Bank of Canada is effectively over-ruling them with higher interest rates ensuring that many fewer homes are built. So much so that we're building fewer new homes today than we were in the depths of the pandemic.
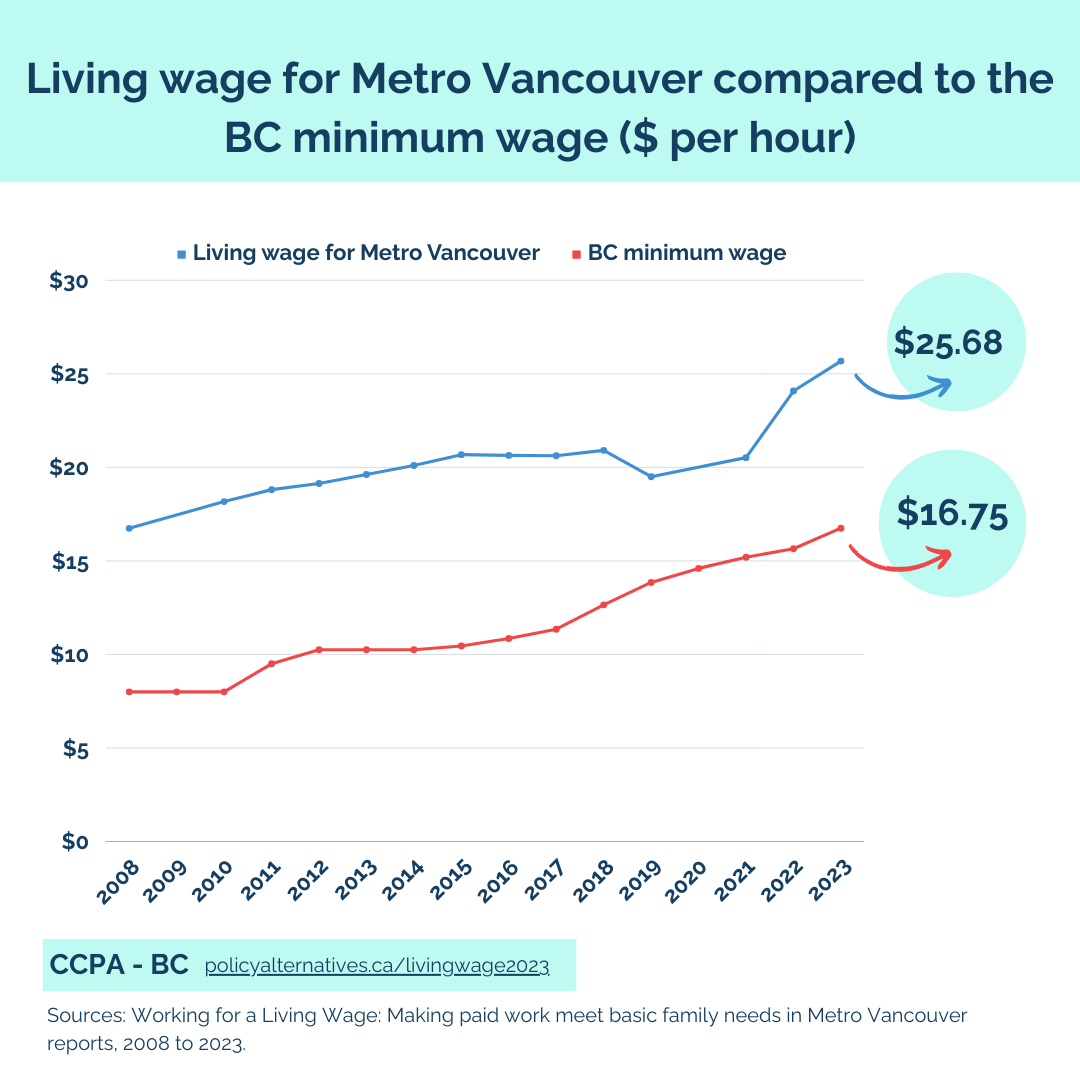
Living wage for Metro Vancouver compared to the BC minimum wage
By Iglika Ivanova, CCPA BC
In November, the CCPA-BC and Living Wage for Families BC released the 2023 living wage for Metro Vancouver, as we do every year. It now takes an hourly wage of $25.68 in Metro Vancouver for two parents each working full-time to support a family of four. A strikingly large gap exists between BC’s current minimum wage of $16.75 per hour and the living wage in Metro Vancouver (as you can see in the Chart). While the living wage has always been higher than the BC minimum wage, the gap narrowed considerably between 2018 and 2021 thanks to a combination of provincial minimum wage increases and policy changes that improved affordability for families. In the last two years, this gap has grown significantly and it’s now close to $9 per hour in Metro Vancouver. While not shown in this chart, the gap is large in all BC communities where living wages have been calculated. The thousands of people who earn less than the living wage continue to face impossible choices—buy groceries or heat the house, keep up with bills or pay the rent on time. The result can be spiraling debt, constant anxiety and long-term health problems. BC’s lowest-wage workers urgently need a raise.
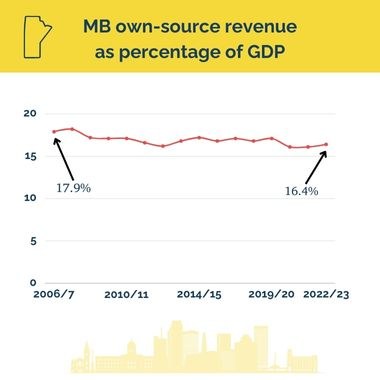
MB own-source Revenue as percentage of GDP
by CCPA Manitoba
CCPA Manitoba has been tracking the loss in revenue for quality public services. Manitoba's own source revenue in relation to GDP has dropped from 18 per cent to 16 per cent in the past 18 years. This has been exacerbated in recent years by massive tax cuts and loss of revenue. The largest benefits go to those with high incomes and the wealthy by increasing tax bracket levels and the basic personal exemption, severe cuts to residential and commercial education property taxes totalling $1.6 Billion dollars.
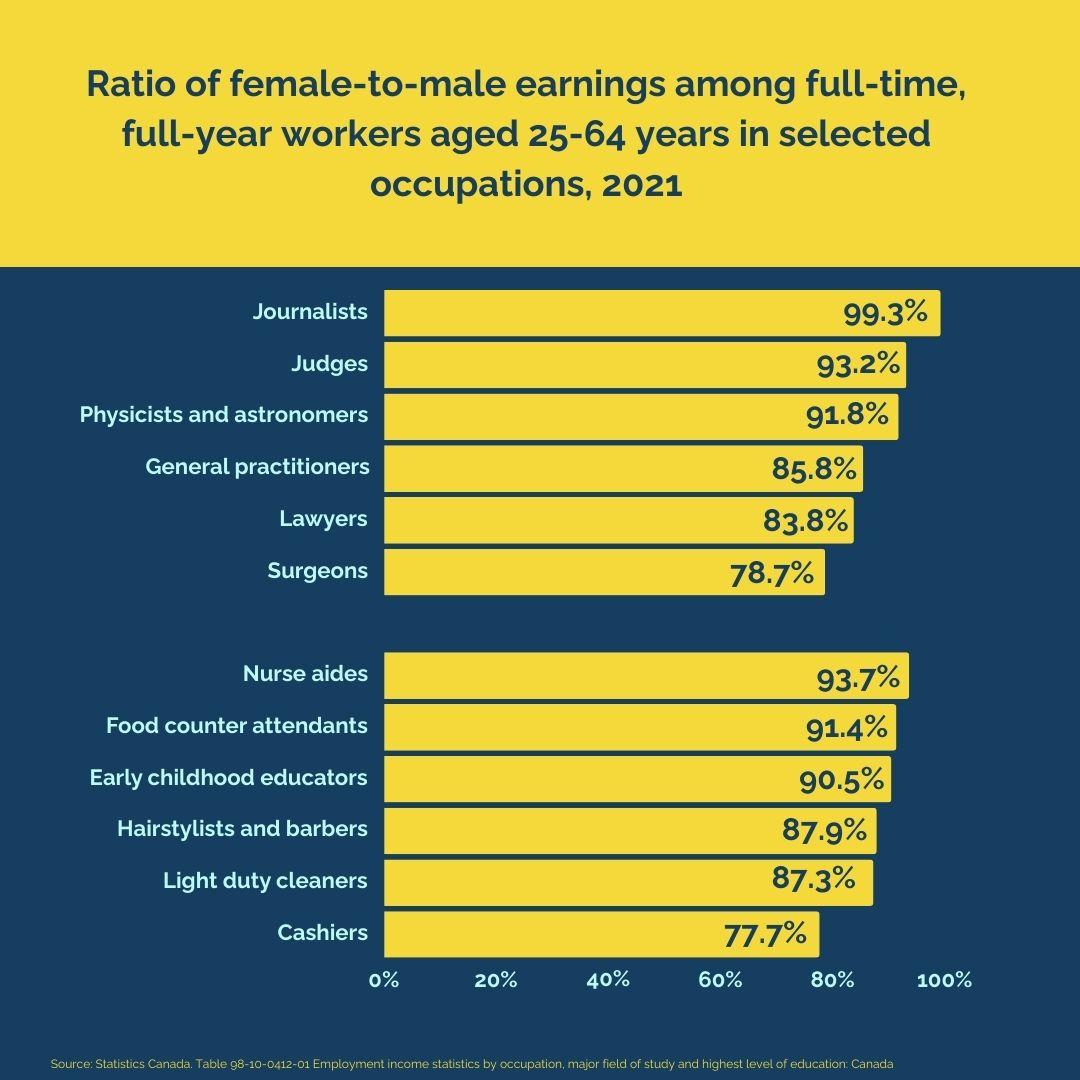
Ratio of male and female earnings among full-time, full-year workers aged 25-64 years in selected occupations, 2021
By Katherine Scott, CCPA National Office
Women have broken into most occupations over the last six decades, but they number in the minority in many of the high-paying roles we saw in this summer's Barbie movie. Women up and down the earnings ladder experience pay gaps, reflecting entrenched systemic bias, the unequal burden of care and outright discrimination. How else to explain the prevalence of wage disparities even in female-majority fields: women make as much or more than men in only seven of the top 20 female-majority occupations. How else to explain the abysmal rates of pay among female workers in the care economy: $19.70 per hour for educational assistants, $20 per hour for early childhood educators and $21.90 per hour for personal support workers (PSWs). While the few women who do work in non-traditional jobs are typically earning more than other women, they, generally earn less than their male peers. Physicist Barbie might have won a Nobel but women physicists have not yet achieved wage parity: their pay packet is worth only 91 per cent, on average, of their male colleagues.'
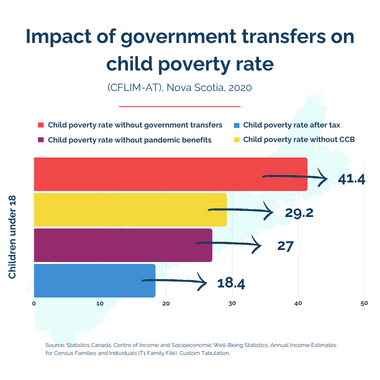
Impact of government transfers on child poverty rate
By CCPA Nova Scotia
At the height of the pandemic, we saw a historic reduction in child poverty in Nova Scotia to 18.4 percent, almost entirely due to federal pandemic relief support and top-ups. Without the temporary pandemic benefits, the child poverty rate would have increased from 2019 levels (24 percent to 27 percent). We know that the Canada Child Benefit has been critical for supporting families with children—without it, the child poverty rate in NS in 2020 would have been 29.2 percent. Without any provincial or federal government transfers, the child poverty rate in Nova Scotia would have been 41.4 percent. The impact of all government benefits still left 31,370 Nova Scotian children living in low-income families, which is more than 1 in every 6. Unfortunately, with the withdrawal of the pandemic benefits, we know child poverty rates have since increased.
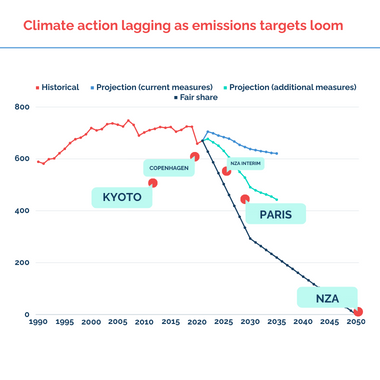
Climate action lagging as emissions targets loom
By Hadrian Mertins-Kirkwood, CCPA National Office
Canada's overall greenhouse gas emissions are finally trending down, but we are still not on track to meet our targets under the Paris Agreement or the Net-Zero Act. The latest summer of record wildfires was a stark reminder that we have no time to waste in getting our planet-choking pollution under control. That will require far more policy ambition and political bravery from a federal government that has mostly relied on climate half-measures to date.
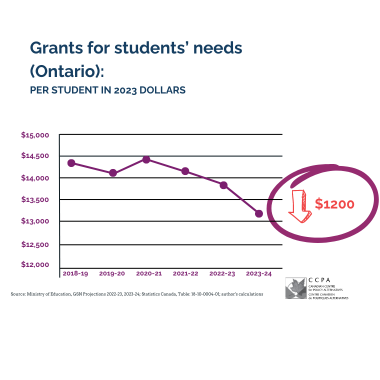
Grants for students' needs in Ontario
By Ricardo Tranjan, CCPA Ontario
Taking inflation into account, school boards will receive, on average, $1,200 less per student in the 2023-24 school year than what they received in 2018-19. The chart shows that funding dropped in the first year of the Ford government, then increased between 2019-20 and 2020-21 due to one-time pandemic funding. But now that money is almost gone, and funding is dropping steeply.
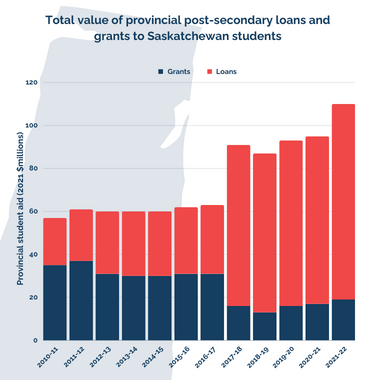
Total value of provincial post-secondary loans and grants to Saskatchewan students
By Simon Enoch, CCPA Saskatchewan
One of the little noticed consequences of Brad Wall's 2017 austerity budget has been the impact on student borrowing due to cuts to Saskatchewan's student grant system. Prior to 2017, loans and non-repayable grants to students for post-secondary education were fairly balanced. However, the Saskatchewan party cuts to the grant system in their 2017 budget forced students to rely even more on borrowing, with the student loan portion of student aid in SK exploding after 2017, while the provision of grants has cratered.
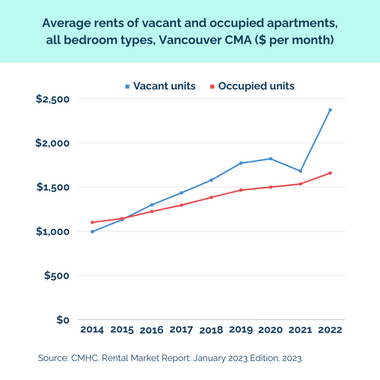
Average rents of vacant and occupied apartments, all bedroom types, Vancouver CMA ($ per month)
By Iglika Ivanova, CCPA BC
Skyrocketing rents put enormous pressure on household budgets in Metro Vancouver and across the country, hoovering up any savings from recent child care fee reductions and government affordability measures like the grocery rebate. While BC (along with several other provincial governments) caps annual rent increases for existing tenants, staggering rent increases can and do occur when units turn over to a new tenant. New analysis from CMHC indicates that there was a large gap between the average rent of units that turned over to a new tenant and ones that did not in major Canadian cities. That gap is eye-popping in Metro Vancouver where in 2022 the average asking rent for vacant units was 43 per cent higher than the average for occupied units. No government efforts to address the high cost of living can succeed without moving the dial on housing affordability. While it has been encouraging to see both provincial and federal leaders speak with increased urgency about tackling Canada’s housing crisis over the last year, progress has been limited and the housing strategies tabled to date are an order of magnitude less ambitious than what is required.
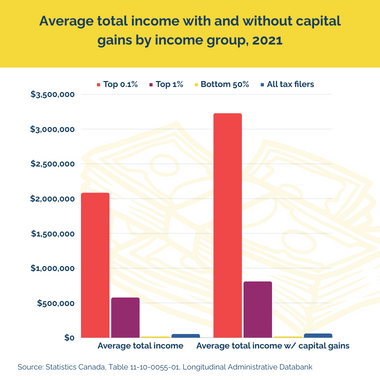
Average total income with and without capital gains by income group, 2021
By Katherine Scott, CCPA National Office
2021 proved to be a good year for the elite few who held onto their jobs and whose bank accounts were flush with pandemic savings. They were able to catch the run up in the stock market while they watched the value of their homes and cottages soar. The top one per cent of tax filers reported a 12 per cent boost in salaries and wages. But the increase in dividend income and capital gains pushed this group of 300,000 people over the top. In 2021, the top one per cent took home an average of $811,800 after dividends and capital gains were tallied—a 40-year high. The top 0.1 per cent took home $3,230,100 after dividends and capital gains—and the top 0.01 per cent posted a stratospheric $12,542,100 in total income—a number too high to include in the chart.


