Canada has made big progress on child care costs—but has a lot of work to do on availability of spaces.
Executive summary
As $10-a-day child care is rolling out across Canada, one of the major remaining stumbling blocks is that there simply aren’t enough child care spaces to meet the demand.
This report examines the availability of child care spaces by postal code across the country and finds child care deserts to be widespread: there were an estimated 759,000 full-time licensed spaces for younger children across Canada in centres and family child care homes in 2023. Of the 1.97 million younger children who might be using those spaces, 48 per cent live in child care deserts.
That means that almost half of younger Canadian children (defined as not yet attending Kindergarten) live in a postal code that has more than three children for every licensed child care space.
Canada needs more child care spaces, which also means more adequately paid early childhood educators (ECEs) to staff them.
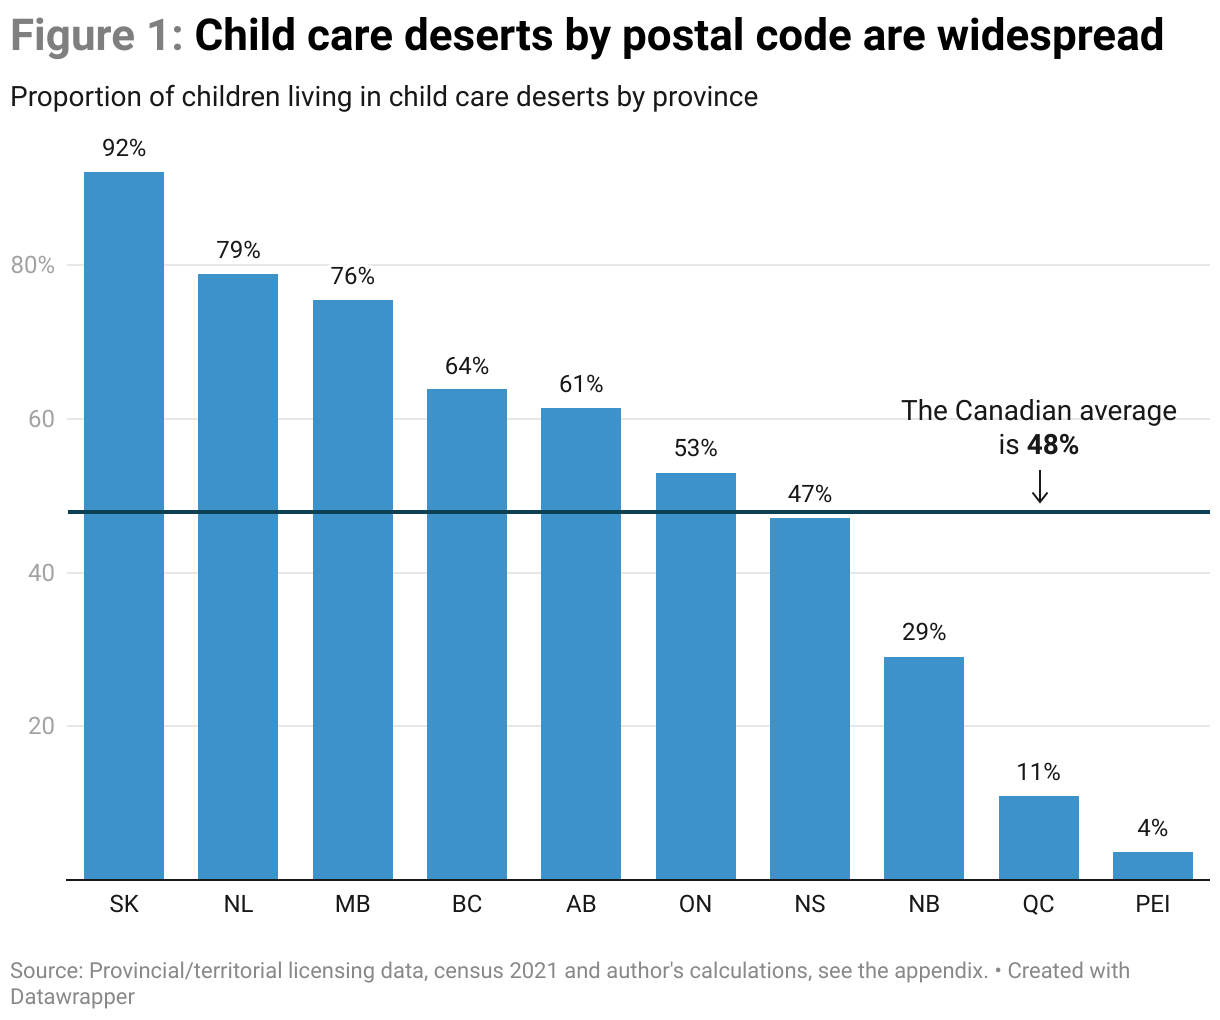
In terms of child care deserts by postal code, here are the provinces listed from those with the highest proportion of younger children living in child care deserts to those with the lowest:
- Saskatchewan: 92% of younger children live in child care deserts
- Newfoundland and Labrador: 79% of younger children live in child care deserts
- Manitoba: 76% of younger children live in child care deserts
- B.C.: 64% of younger children live in child care deserts
- Alberta: 61% of younger children live in child care deserts
- Ontario: 53% of younger children live in child care deserts
- Nova Scotia: 47% of younger children live in child care deserts
- New Brunswick: 29% of younger children live in child care deserts
- Quebec: 11% of younger children live in child care deserts
- P.E.I.: 4% of younger children live in child care deserts
Saskatchewan has the highest proportion of children living in child care deserts by far: 85,500 younger children live in a postal code where there are more than three children per licensed space. This means that many more children are living in child care deserts in Saskatchewan than Quebec, even though Quebec has four times the child population. Saskatchewan parents who live in downtown Regina stand the best chance of finding a child care space nearby.
Newfoundland and Labrador comes close to Saskatchewan: 17,400 children live in a postal code with more than three younger children per full-time licensed space.
At the opposite end of the spectrum, Prince Edward Island has the fewest child care deserts: the smallest province only has one postal code that is a child care desert. Children living in that area make up only 4 per cent of younger children on the island.
Quebec ranks second best: 11 per cent of younger Quebec children are living in child care deserts, amounting to 50,200 younger children. Unlike the slightly higher-ranked P.E.I., it is a much larger province, with 421 postal code prefixes.
The report also looks beyond postal codes, examining child care coverage rates in 50 Canadian cities, including all provincial and territorial capitals. The coverage rate is the proportion of full-time licensed spaces for every child not yet in Kindergarten.
For parents, infant spaces are the hardest to access. Only eight Canadian cities meet the 33 per cent coverage rate for infants (which is a goal for the European Union) and they are all in Quebec. This includes Terrebonne, Laval, Levis, the Island of Montreal, Longueuil, Saguenay, Gatineau and Quebec City. Charlottetown P.E.I. comes close, with a 28% coverage rate.
Most Canadian cities have a coverage rate below 20 per cent, meaning that in those cities, there are at least five infants for every licensed infant space. St. John’s, Newfoundland and Labrador, the Ontario cities of Barrie, Guelph, Hamilton and Brampton, and Saskatoon scored particularly badly, with low availability of infant spaces compared to their population of infants. In those cities, there is less than one licensed space for every 10 infants.
Using a somewhat different approach to examine which cities have the most child care coverage for children who are not yet in Kindergarten including infants, the picture changes slightly but the trends continue.
Whitehorse, Charlottetown, and the island of Montreal rank best in terms of coverage rates, with roughly seven licensed spaces for every 10 children who are not yet in Kindergarten.
At the other end of the spectrum are Saskatoon, Regina, Kitchener, and Vancouver. In each of these cities, there are roughly two licensed spaces for every 10 children, equating to coverage rates of just over 20 per cent.
Our content is fiercely open source and we never paywall our website. The support of our community makes this possible.
Make a donation of $35 or more and receive The Monitor magazine for one full year and a donation receipt for the full amount of your gift.
As this analysis shows, the availability of an age-appropriate child care space is highly variable. It shows, in some detail, that child care deserts are a feature of child care provision all across Canada. This reality, which represents the dysfunctional child care market that has developed over time as Canada has, until now, lacked unifying early learning and child care policy and funding.
As the federal government and provinces/territories have begun to roll out a child care system, not a market, its high-level early learning and child care policy framework is unified by the principles of affordability, accessibility, quality, inclusivity and flexibility. Within this, the commitment that early learning and child care expansion will be primarily public and non-profit is entirely consistent with evidence-based policy making and has been made explicitly and implicitly. This suggests that purposeful and rational expansion of public and non-profit licensed child care is a critical next step to ensure that all Canadian families can access the more affordable fees already in play. From many perspectives, supporting, facilitating and monitoring the impact of more accessible, more affordable, more inclusive and—importantly—better quality child care needs to be a collaborative effort by federal, provincial, territorial, Indigenous representatives, together with civil society, child care community partners, and parents in order to maximize success.
The report concludes with seven recommendations to address the shortage of child care coverage in Canada.
Introduction
The year 2022 stands out as a milestone year for Canadian parents. In 2022, most parent fees for licensed child care were dramatically reduced as part of the first phase of an ambitious child care plan launched by the Government of Canada. The large-scale, multi-year project, which intends to build a system of high-quality, universally accessible child care from coast-to-coast-to-coast, was announced in the 2021 federal budget. It will be implemented over time through agreements negotiated between the federal government and each of Canada’s 13 provincial and territorial governments, in alignment with a parallel framework co-developed by governance groups representing First Nations, Métis and Inuit people.
In this first year, the federal government required provinces and territories to use their new federal transfer funding for the first phase of reducing parent fees—a 50 per cent reduction in average fees by the end of 2022 and $10-a-day fees by 2025–26. The reduced fees took centre stage in making the plan irresistible to parents, encouraging provinces and territories to come to agreements with Ottawa and increasing parents’ demand for newly affordable child care.
But the federal government, provinces and territories committed to more than just fee reductions when signing the bilateral agreements for the federally initiated and funded Canada-wide early learning and child care plan. They also committed to solving longstanding staffing and supply issues in child care as part of what has been called a “transformation,” moving from Canada’s child care market to building a child care system.
This transformational child care plan promises substantial expansion of licensed child care, “in particular…to support primarily not-for-profit sector child care providers to grow quality spaces,” as the federal 2021 budget specifies, reiterated by the bilateral agreements and Bill C-35, the federal child care legislation. But to effectively move ahead on expansion, three main challenges must be addressed.
The first of these is the Canada-wide child care workforce crisis. Adequate child care staffing has been an acknowledged problem since well before the pandemic, which exacerbated long-identified recruitment and retention issues, especially retention. Across Canada, many of the qualified early childhood educators (ECE) who complete post-secondary ECE programs choose not to work in child care. Many others leave the child care workforce within a few years. The hours are often not very good, the pay is poor, working conditions and career ladders are unimpressive and early childhood educators don’t get the respect they deserve. So it’s no surprise that retention is a substantial issue and will remain an impediment to system expansion unless there are substantial changes.
In labour-intensive early learning and child care programs, the workers are the program. The staffing component is the most important element of the program. Research shows the importance of ECE training for program quality, staff morale and on children’s development. If there is no one who will come to work to care for, nurture and educate children in a physical space, there is no child care program. But the research1 also heavily underlines that there is more than employing an adequate number of responsible adults to ensure basic safety. Whether they have the educational background for the job, how they are paid, whether they are well supported with resources and good working conditions, and whether they feel valued, which improves morale, all contribute to the quality of child care that enables children to get the best start in life, which is a key goal of early learning and child care programs.
A second significant barrier to expanding the supply of early learning and child care is that developing or creating child care services has mostly been treated as a private responsibility in Canada. As a 2020 paper on child care expansion described,
In Canada, whether or not child care services are available so parents can go to work and children can be well cared for mostly rests on whether private individuals initiate their creation, take it through the development process, maintain it, finance it, and sometimes decide when to shut it down.2
This paper noted that Canada’s private approach is in contrast to the public processes used in planning and building the more robust, well-built child care systems of which many other countries boast. It is also in contrast to Canadians’ experience in K-12 education, where governments take responsibility for planning and ensuring that schools are publicly funded and built where and when they are needed. This idea that creating a universal equitable child care system must rely on public—not private—processes, such as planning, mapping, funding, initiating, building, managing, supporting, was put forward by the OECD in its review of Canadian early learning and child care in 2004:
[T]he provision of services across a city or territory—not least in terms of mapping where services should be placed—should be overseen by a public agency. Valuable initiatives, both at provincial and community board levels, already exist in Canada in this matter, but in many instances, public responsibility for planning and supporting ECEC services needs to be developed.3
Practically, this can take the form of integrating child care into public planning at senior and local levels of government, more public management of child care, forecasting parental demand and child care workforce needs, ensuring that physical facilities for child care are part of the social infrastructure—not an afterthought, developing public strategies for growing child care supply over a period of time and supporting all of these with good data.
The third key barrier to equitable expansion is the distribution and lack of appropriate physical spaces. Physical child care environments are important in hindering or facilitating quality programmes. Indeed, some experts have called the physical child care environment the “Third Teacher.”4 Creating a child care centre5 therefore has a capital funding component, and the absence of earmarked capital funding poses a significant barrier to creating quality child care. Facilities for child care need to be built, retrofitted or renovated and equipped to accommodate young children and meet the licensing requirements of child care. Thus, adequate capital funding is essential to support expansion. In much of Canada, there has historically been little or no public capital funding earmarked for child care. Consequently, child care has frequently relied on surplus, left-over, inappropriate space or goodwill (of a local government or not-for-profit organization) community fundraising or private financing. This has resulted in child care facilities with inconsistent quality, precarious tenure and inequitably distributed supply.
At the end of 2022, it was clear that parent fees were declining in most places. As fees continue to fall, this will continue to drive parental aspirations and decisions about child care. It will continue to raise demand for affordable, high-quality, licensed child care. Without more and better distributed expansion, this demand will simply cause wait lists to balloon, stoking frustration and cynicism in the many communities with inadequate, little or no licensed child care. This will also contribute to pressure to permit for-profit sector expansion to meet the need, despite the well-documented quality, effectiveness and ethical concerns associated with for-profit child care.6 Encouraging more parents to use licensed child care is one of the arguments for reducing child care fees: as the International Monetary Fund7 noted about Canada, the more that parents (mothers) are able to work, the more economic growth, tax revenue and prosperity are created. But lower fees are of limited use if parents are unable to access the affordable child care they need due to long wait lists or the absence of options.
Child care deserts research
At the end of the first implementation phase of the ambitious Canada-wide child care plan, it is critical to understand the starting point of child care space availability. The term “child care desert” is often used to reference a lack of or inequitable distribution of child care. It originates with U.S. researchers Malik and Hamm in their report for the Center for American Progress, Mapping America’s Child Care Deserts, published in 2017. They used the term to refer to coverage in all centres, family child care providers, Head Start spaces (part-day) and public and private preschools’ (part-day), and they identified demographic and spatial characteristics of child care deserts in the U.S.
Although the term is also used in Canada to signify unequal access to child care, except for our 2018 study in which we explored and evaluated child care deserts in Canada,8 Canadian researchers have not systematically analyzed child care deserts. A 2018 paper by Susan Prentice and Linda White9 discussed the gaps in access and distributional disadvantages, such as the “Matthew effect,” meaning a situation in which the gaps in access they describe have the effect “whereby increasing public provision ends up advantaging higher income rather than lower income groups.” They did not map or analyze child care deserts but they did discuss the high-level policy conditions that produce them. For these reasons, this 2023 study is pioneering research in Canada, using the U.S. concept and general method but applying a Canadian policy and method lens.
Methods and assumptions
This report refines our 2018 methodology on child care deserts by adding counts of child care spaces by age group and explores additional and more refined analyses of the data. It updates the 2018 framework by using new child population figures from the 2021 census and available information on the number and location of licensed spaces at the end of 2022.
This report also adds to the potential for practical uses of the concept of child care deserts by discussing:
- The assumptions for determining which children and which child care spaces are in the analysis and which are not.
- The assumptions for defining a child care desert and choosing targets or coverage levels for this analysis.
It then presents and discusses the results in several ways:
- By provinces and territories.
- By size of community and provinces/territories.
- By city, using 50 cities/towns covering all provinces/territories.
- By age group.
Finally, it closes with some observations about the method and approach used here and considers it as a tool to contribute to the building and implementation of a Canada-wide child care system.
Defining the children and spaces included: What are the assumptions?
One basic approach to determining if there are “enough” child care spaces is to calculate a coverage rate for a given geographic area. This requires knowing the number of children who require care in that area and the number of licensed spaces that are available to them. In several parts of this report, we use the Forward Sortation Area (FSA), which is the first three digits of the postal code as the lowest level of geographic identification. The FSA defines an area in which a child lives and where one might reasonably expect to find a school, child care and other services.
This geographic approach is convenient because census data provides child counts at this level, along with many other census variables, such as income, poverty, population density and so on, allowing for further analysis.10 The postal code for regulated child care services is also readily obtainable from provincial license lists, allowing for a match up.
The child counts in this report are from the 2021 census and the child care space counts were collected from provincial/territorial licensing registries in the fall of 2022 and January 2023; further space breakdowns were provided by provincial/territorial child care officials.
This report focuses on full-time licensed spaces and the children who are eligible to fill them, generally children who are not yet in Kindergarten. Entrance into Kindergarten differs by province in both the age criteria and whether those programs are full-school day or part day.11 Most provinces allow children to enter school in September of the calendar year in which they turn a certain age; four, for example. This means that for eight months of that year, from January to September, many of those four-year-olds (for example) would still need-full day child care. We’ve made adjustments in each province/territory to match the Kindergarten age entrance criteria and the configuration of Kindergarten. Throughout the report, the term “younger children” refers to children not yet in Kindergarten and who are eligible for full-time child care spaces.
Each province and territory licenses full- and part-day child care centres and regulated family child care either in individually licensed child care homes or in homes that are under supervision of licensed or approved agencies according to provincial/territorial regulations. These form the foundation of our licensed child care counts, which include full-time spaces only.
It is of note that the number of licensed spaces or “licensed capacity” may be more than the number of children enrolled. At the same time, there may be instances in which more than one child is enrolled to fill one licensed space at different times (i.e., families may share a space).
More specifically relevant to the pandemic: data from several sources show that enrolments were low in 2020 (when most licensed child care was closed by public health authorities from March through the summer) and remained low throughout 2021, as the pandemic continued.12 13 14 As demand increased, staff shortages reduced the number of spaces available to care for children. For instance, in British Columbia in 2022, 45 per cent of employers reported losing more staff than they could hire and 27 per cent reported turning away children because of lack of staff.15 So centre capacity, and therefore enrolment, may be lower than the maximum number of licensed spaces.
With these caveats in mind, the licensed space counts in this report reflect a best-case scenario coverage rate. That is, we make the assumption that each licensed space was filled with one child.
The goal of the study is to match, as closely as possible, the full-time spaces that are available with the children who are eligible to use them on a jurisdiction-by-jurisdiction basis. Each jurisdiction has different provisions for when children enter Kindergarten programs, whether Kindergarten is full-time or part-time and where Kindergarten-age children are cared for when they are not in school. Therefore, the denominator of how many children are age-eligible for full-time child care spaces varies by province/territory. For a complete table of provincial/territorial Kindergarten programs and age assumptions in this paper, see the appendix.
As noted above, our count of spaces includes only full-day spaces. In some jurisdictions, centre licenses allow flexible allocation of spaces so long as licensed ratio and staffing requirements are followed. Thus, where it was not possible to disaggregate spaces based on age, they were all included by default. As well, family child care spaces are not designated by age, although regulations specify a maximum number of children in a home and by age. For the purposes of this report, we assume that all family child care homes have one infant and three more toddlers or preschoolers, making for a total of four younger children who aren’t yet in Kindergarten in each child care home. This is intended to be an average for the purpose of calculation, not to represent the situation in every family child care home.
Several provinces use an agency model for family child care, whereby the agency contracts with and supervises a number of family child care providers. An agency might not operate at full capacity or might be attempting to recruit new providers. As with centres, we include all regulated family child care homes that are contracted with agencies to provide a best-case scenario. Complete lists of providers working with an agency were not available to us, so we allocated their capacity within the areas in which they report that they operate.
Unregulated or informal family child care arrangements16 are not necessarily illegal, but there is no public oversight and no list of unlicensed homes. They are not included in this research.
Defining child care deserts and coverage rates
The next question is about targets: what coverage ratios should we seek? The starting assumption is not that the desired target is a full-time space for every child who is not yet in school, beginning at birth. Child care is not mandatory, as school is after Kindergarten (and as Kindergarten is in several provinces/territories). Parental leave is intended to cover parents to take leave from work in the first year of a child’s life, although its implementation in Canada is imperfect. Additionally, if parents are not in the paid workforce, are not employed full-time or have close relatives, they may not be looking for full-time child care. However, the international assumption of most universal early learning and child care systems is that “universal” means that all children are entitled to it without regard to their parents’ work status. At the same time, since Canada is only at the beginning of developing an affordable, accessible child care system, perhaps a phased-in approach to coverage targets would make sense.
In our 2018 report on child care deserts, a FSA with a coverage rate of less than one-third of the child population was considered to be a “child care desert.” Put another way, if there were more than three children below school-age for every full-time licensed child care space in a postal code, it was deemed to be a child care desert. This is similar to the U.S. approach to analyzing child care deserts, although a smaller geographic unit is used there.17 Alternatively, a recent U.S. analysis used an approach of estimating the child care spaces within a 20-minute drive time.18 19 20
In a broad-scale child care target-setting initiative, in 2002, the European Union developed the “Barcelona targets”—specified coverage rate targets21 that all members would work towards. EU member states agreed to work toward a supply of child care services for at least 90 per cent of children between three years of age and school entry-age and 33 per cent of children under 36 months by 2010. A 2013 report assessing how countries’ child care coverage progressed toward these targets 10 years later found that 10 EU member countries met the target for 0–2 year olds and another 10 met it for three-year-olds to mandatory school-age.22
This report maintains the 2018 definition: a FSA with more than three23 children who are not yet in Kindergarten for every licensed full-time space will be designated a child care desert. These spaces can be in centres or regulated family child care settings.
The following sections first assess distribution of child care deserts by postal code by provinces, then by community size. The coverage rates in 50 Canadian cities are then examined, where we apply the Barcelona targets to determine how many of those cities meet the 2002 European targets.
Results
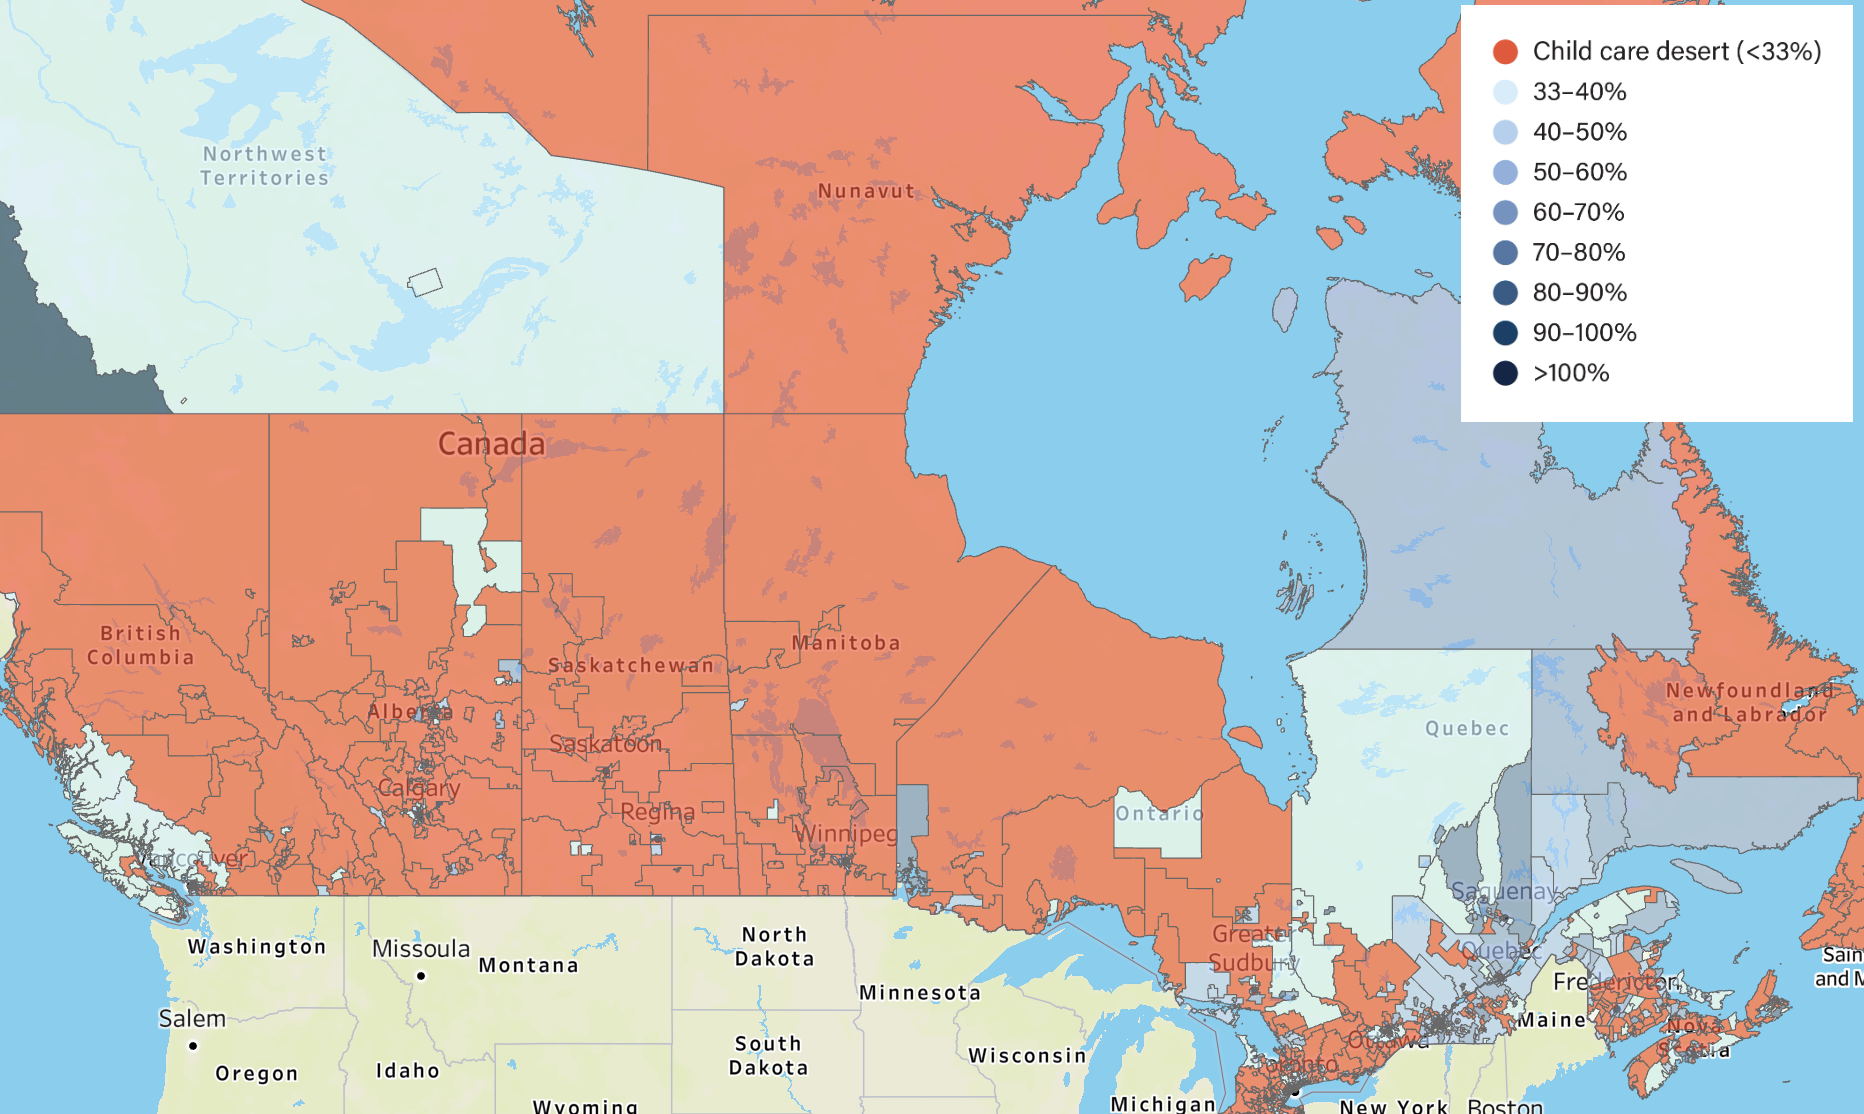
Child care deserts by postal code are widespread
We estimate that there were 759,000 full-time licensed spaces for younger children across Canada in centres and family child care homes in 2021. There were 1.97 million younger children who might be using those spaces. However, 48 per cent of those children, or 946,000, live in child care deserts. Put another way, almost half of younger Canadian children live in a postal code that has more than three children for every licensed child care space.
Figure 1 breaks down child care postal code deserts by province. It shows the proportion of children in each province who are living in a child care desert.
While data for the territories is available, there are too few FSAs to provide a meaningful territory-wide analysis. Generally, the territories have one FSA for the capital and one or two more to cover the remainder of vast geographic areas that are sparsely populated. The territorial capitals are covered in the cities’ analysis later in this report, but they are not included in this postal code analysis.
In Prince Edward Island (P.E.I.), only one postal code is a child care desert, located in the north part of Charlottetown (postal code starting with C1C). Children living in that desert make up 4 per cent of all children on the island. There are only seven postal code prefixes province-wide. P.E.I. now provides universal pre-Kindergarten, a part-day program, which is a hybrid child care-Kindergarten program: publicly funded for all families (no fees), in child care centres and licensed as child care.
In Quebec, 11 per cent of children live in child care deserts. Unlike the slightly higher-ranked P.E.I., it is a much larger province, with 421 postal code prefixes. All told, 11 per cent of Quebec children are living in child care deserts, amounting to 50,200 children.
New Brunswick has 29 per cent of its younger children living in child care deserts, well below the national average of 48 per cent. This represents 10,700 children in the province living in a postal code where there are more than three children for every full-time licensed space.
At the other end of the spectrum, we find provinces in which almost all children live in a child care desert, with very few spaces for younger children. Saskatchewan has more younger children living in child care deserts than any other province—92 per cent. This represents 85,500 younger children living in a postal code where there are more than three children per space. This means that many more children are living in child care deserts in Saskatchewan than Quebec, even though Quebec has four times the child population. The non-deserts in Saskatchewan are located mostly in downtown Regina.
In Newfoundland and Labrador, 79 per cent of children live in child care deserts. This means that 17,400 children live in a postal code with more than three younger children per full-time licensed space.
There are no obvious, straightforward answers as to why some provinces have fewer children living in child care deserts. P.E.I. and Quebec both have set fees and both provide direct operational funding to child care services for some years. It might be tempting to point to this as the reason why there are fewer children in deserts in those provinces. However, Manitoba also sets fees and operational funding, which it has done for many years, yet three quarters of children in Manitoba live in child care deserts.
Alternatively, one could speculate that it might be easier to provide child care in smaller Atlantic provinces like P.E.I. and New Brunswick. However, Nova Scotia’s coverage is at the national average (48 per cent living in child care deserts) and Newfoundland and Labrador, which just recently moved to set fees and operational funding, has, proportionally, the most children living in child care deserts.
Another explanation that could be considered is that the presence of more for-profit child care is key. Yet this too is inconsistent. While child care provision in higher-coverage P.E.I. and New Brunswick is predominantly for-profit provision, it is also predominant in lower-coverage Newfoundland and Labrador and is almost non-existent in very low-coverage Saskatchewan.
In another example considering the premise that for-profit services make the difference in coverage: British Columbia is a fairly low-coverage province. With 64 per cent of children living in child care deserts, it is much closer to the low-coverage jurisdictions than the high. British Columbia has had a considerable increase in for-profit provision in recent years, increasing from 43 per cent to 53 per cent of spaces operated for profit between 2010 and 2019. But full-day coverage in Quebec for 0-4-year-olds over a 20-year period also became much more dominated by for-profit care; in 2021, 55 per cent of full-day spaces were for-profit in Quebec, with is close to B.C.’s 53 per cent, but Quebec has almost the best coverage among provinces, with only 11 per cent of children living in child care deserts. The presence of a for-profit sector does not appear to make the difference between high or low coverage.
Higher levels of child care provision in P.E.I. and Quebec isn’t new, but it was evident back in the 1990s. Although a slightly different measure compared to child care deserts, P.E.I. topped all other jurisdictions for the percentage of children aged 0–5 for whom there was a regulated space in a centre as far back as 1992.24 Quebec ranked quite average in terms of coverage in 1992, but it had more than doubled its spaces by 1998.25 This was over the same decade during which its $5/day set-fee program was initially introduced in Quebec, showing that reducing fees while rapidly increasing licensed spaces is possible and has a historical precedent.
Overall, while these analyses show how pervasive child care deserts are, and where they are located, as well as information about what kind of communities are likely to be better supplied with child care, the current data and analysis are not sufficient to offer explanations of why and how they arose.
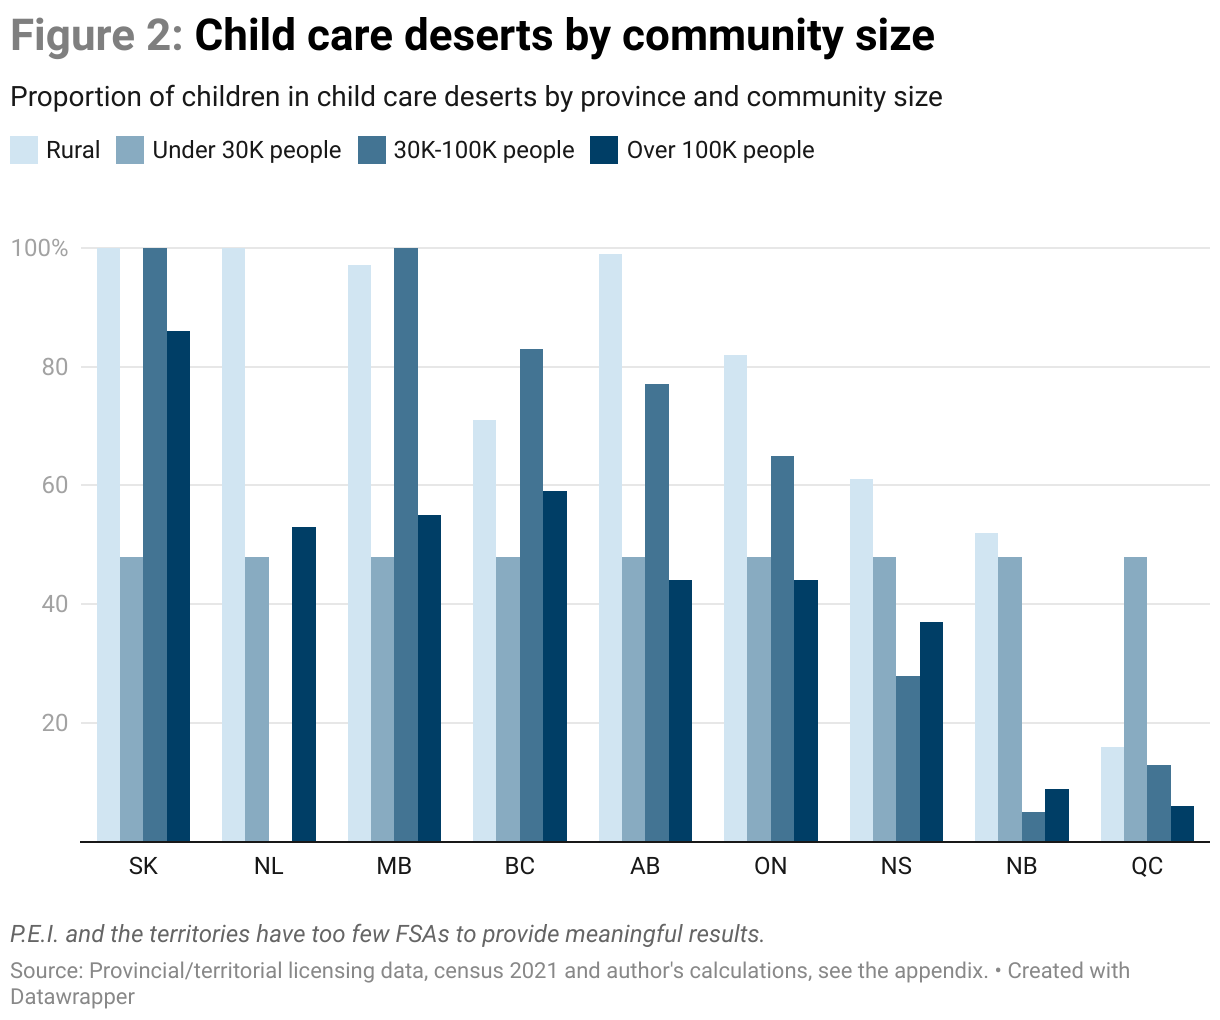
Child care deserts by community size
Broadly, although not universally, larger urban centres with over 100,000 people are less likely to have child care deserts. Conversely, rural areas and smaller towns are more likely to have child care deserts. In geographic areas with low population density, such as smaller towns and rural areas, it is harder to locate child care centres or even family child care homes close to where children live, as children needing child care are widely dispersed. A 2015 study of rural child care issues described it this way:
Two main rural-specific factors contribute to rural families’ child care challenges: low population density and the prevalence of non-standard hours and seasonal work. Large geographic distances not only make it harder for parents to access child care but it is difficult for service providers to survive financially when serving populations who not only have a variety of schedule and seasonal needs but are spread out over considerable distances.26
Figure 2 again examines the proportion of children living in child care deserts, but breaks it down both by community size and province/territory. Unfortunately, P.E.I. and territories are excluded because they have so few postal codes that this extra level of analysis isn’t possible.
The highest proportion of children living in child care deserts is in Saskatchewan, where child care deserts are the norm for almost all children. This is true whether children live in the province’s larger cities of Regina and Saskatoon or whether they live in its smaller towns and rural areas. Towns with less than 30,000 people show fewer children living in child care deserts, but this represents only two FSAs—one on the outskirts of Regina and one in Swift Current.
Newfoundland and Labrador children fare markedly better in St. Johns, the only 100,000-person city in the province, than they do in smaller towns and rural areas. Even in St. Johns, however, the proportion of children living in a child care desert is greater than the national average, at 53 per cent. In smaller towns (<30K) and rural areas of the province, basically all children live in child care deserts.
Manitoba shows fewer children in child care deserts in Winnipeg (55 per cent)—its one city with more than 100,000 people. However, outside the capital, child care deserts are almost universal no matter where children live, from larger towns to rural areas.
British Columbian children are less likely to be in a child care desert if they live in its larger cities with more than 100,000 people. However, even B.C.’s bigger cities show a greater likelihood of living in a child care desert than the national average. In smaller towns, communities and rural areas, children are more likely to be living in child care deserts. One of the differences between B.C. and Ontario or Alberta is that younger B.C. children who are living in rural areas and smaller towns are not quite as deprived of child care spaces as those in cities. In contrast, city dwellers in Ontario and Alberta have slightly better coverage than less densely populated areas.
How children fare in Ontario and Alberta are similar to one another, with the proportion of children living in child care deserts in big cities at 44 per cent, slightly better than the national average of 48 per cent. However, the smaller the community, the greater likelihood of Ontario and Alberta children living in a child care desert. In rural areas, 82 per cent of Ontario children live in a child care desert and virtually all children in rural Alberta do as well.
In more populated areas of Nova Scotia, from small towns to its one big city of Halifax, about a third of children live in child care deserts. Finding a child care space is twice as hard in rural areas, where 61 per cent of children live in child care deserts.
New Brunswick has practically no child care deserts in its cities and towns. Whether in cities like Fredericton and Moncton, with populations of more than 100,000, or smaller towns with less than 30,000 or between 30,000 and 100,000 people, the proportion of postal codes with more than three children per space is quite low. Unfortunately, this is not the case in New Brunswick’s rural areas, where half of the children live in child care deserts.
As noted above, Quebec has managed to keep child care deserts largely at bay. Even when it is broken down by community size, Quebec has managed to have a remarkably low proportion of children in child care deserts. Quebec’s worst category, with 28 per cent of children living in child care deserts, is small communities of under 30,000 people. But even in more sparsely populated rural areas, which make up much of Quebec’s north, only 16 per cent of children live in child care deserts, illustrating that creating a fairly adequate supply of licensed child care in remote areas is possible in Canada.
The Timbit effect of child care in big cities
To date, there has been little provincial or territorial planning to determine where child care providers will be located and it clearly shows in the results. By and large, groups or individual operators have decided for themselves where they’d like to locate. In many cases, there may be no operator to step forward in a location where child care might be needed. Historically, leaving location decisions to “the market” has yielded specific patterns in big cities. Particularly when location decisions include a profit motive, commercial service providers are likely to locate where their business is most likely to make money. This may or may not be where it’s most useful from an equity or distribution perspective. This may also, of course, apply to not-for-profit providers, which may locate to a centre that is most financially viable and not necessarily where it serves the greatest need.
One effect of this kind of approach is that some neighbourhoods, communities or whole towns—especially those that are not profitable or break even—are poorly supplied with child care; many entirely lack services. It has certainly not resulted in a pattern of equitably distributed child care services close to where families across the income spectrum actually live.
Locating child care to maximize business opportunities or to break even stands in contrast to the public school system. Public schools are publicly owned and operated and public education is a legal entitlement. Concerted planning goes into putting schools close to where children live; often, what “close to where children live” means is regulated. As a result, there is a more even, equitable distribution of public schools.
This section shows the “Timbit” effect, continuing to use postal codes as the unit of analysis. The maps of Toronto, Ottawa, Calgary and Montreal are reproduced below. (Note that a complete map of Canada is available) showing all cities and postal codes. These maps illustrate coverage rates by postal code prefix. Darker postal code areas show better coverage rates and better access to child care. Lighter areas show lower coverage rates, thus poorer access to child care.
The maps of Toronto, Ottawa and Calgary were chosen to illustrate a common pattern, one that is evident in many cities in Canada. The coverage rates—access to child care—are better in city downtowns than in the suburbs. In many of the suburbs, the coverage rate drops below 33 per cent, making these postal codes child care deserts. This research shows that although not all suburban postal codes are child care deserts, it is a trend.
Certainly downtown postal codes are geographically smaller and population density in those areas is higher, so centre viability leads service providers to locate in those areas. It may also be that some child care has been intentionally located to provide child care for downtown workers who commute with their children. As well, there may also be more commercial real estate in city downtowns that is easier to retrofit or renovate for child care.
Our results indicate that it is common for downtown postal codes to show a coverage rate of more than 100 per cent. That is, there are more licensed child care spaces than younger children living in that postal code. In part, this is due to fewer children living in downtown business districts, therefore, the spaces are not necessarily for resident children but also for commuters’ children. This fits with what we know: many parents commute downtown to their jobs, using child care close to where they work instead of close to where they live. This may or may not be what parents want, but in an environment in which they have limited options, parents often take what they can get. For a family with more than one child, it complicates matters to have an older child in a local school and a younger child commuting with a parent across town.
Through the prevailing child care market forces, we see patterns of child care provision resembling Timbits (rather than donuts27): city downtowns have good access to licensed child care, whereas suburban or rural areas have poorer access.


It’s worth comparing the cities above with the Montreal area shown below. The map of Montreal shows a more even coverage across the Island of Montreal and the surrounding suburbs on the North and South shores. We don’t see the same Timbit effect, where downtown has high coverage rates with the suburbs left far behind. Instead, we see relatively good child care access all around the metropolitan area.

Coverage rates for big cities
In the next section, we move from analyzing child care deserts using postal codes to analyzing Canadian cities as a whole by ignoring postal code divisions and including all spaces and children within city limits. This section includes all Canadian cities with more than 6,500 younger children in 2021 and also includes all provincial or territorial capitals.28 There are 50 cities in all. In this section, rather than looking at the proportion of children who are living in child care deserts by postal codes, we look at the coverage rate within the entire city. The coverage rate is the proportion of full-time licensed spaces for every eligible child. Since the rates are calculated across the entire city and not within a postal code, it assumes that every space is available to every child in that city. Conceptually, it envisions parents driving (or biking, walking or using public transportation) around the city to find a space for their child, whereas deserts, in essence, restrict parents to spaces closer to their homes (i.e. within the same FSA). Of course, parents are not always able or willing to transport their child to any available space in their city. Nevertheless, reporting data by city is useful because many parents who live in cities are likely to look for, and use, spaces outside their home postal code.
This section also looks at the availability of licensed child care spaces by age group. For this analysis, most provinces and territories were able to provide licensed infant spaces. The child care definition of an infant differs slightly by province or territory and not all jurisdictions have a separate infant age group. To get proper licensing counts, we needed to match each jurisdiction’s age range of their youngest group, which starts at zero months and whose upper end is between 18 and 24 months. The infant counts in each city were adjusted to properly match the appropriate infant child care age definition in that province/territory to obtain the correct denominator. British Columbia does not have an infant category, so B.C. cities are excluded from Figure 3. See the full provincial/territorial age definitions in the appendix.
The Barcelona targets for EU countries discussed above specified a coverage rate of 33 per cent for younger children under 36 months—somewhat older than infant definitions covered in the Canadian context. Even though paid maternity and parental leave in Canada outside Quebec has many gaps, particularly with regard to eligibility and affordability, many infants in Canada are likely to be home with a parent (mother), especially in their first year or possibly longer due to the recent extension of parental leave benefits to 18 months, as maternity and parental leave are accessible to many. However, the scarcity and high cost of licensed infant child care is closely linked to parents’ employment decisions following the birth of a child.
Whether considering only infants or all children who are not yet in Kindergarten for most of the day, the data show a huge range of coverage rates in Canadian cities.
B.C.’s youngest age rate is below 36 months, which is much older than other provinces’ infant age and is more of an infant and toddler category that isn’t directly comparable, so B.C. cities are excluded. Alberta also doesn’t specifically license infant spaces, so Alberta cities are excluded.
Based on our analysis, eight Canadian cities would meet the 33 per cent coverage rates for infants in Canada, as shown in Figure 3. The Quebec cities that would meet this goal are also the biggest cities in that province. Charlottetown, P.E.I. and two more Quebec cities (Trois Rivieres and Sherbrooke) come fairly close, reaching 27 per cent to 28 per cent of coverage for infants.
Most of the Canadian cities included in this study have a coverage rate below 20 per cent, meaning that in those cities, there are at least five infants for every licensed infant space. St. John’s, Newfoundland and Labrador, the Ontario cities of Barrie, Guelph, Hamilton and Brampton, and Saskatoon score particularly badly, with poor availability of infant spaces compared to their population of infants. In those cities, there is less than one licensed space for every 10 infants.
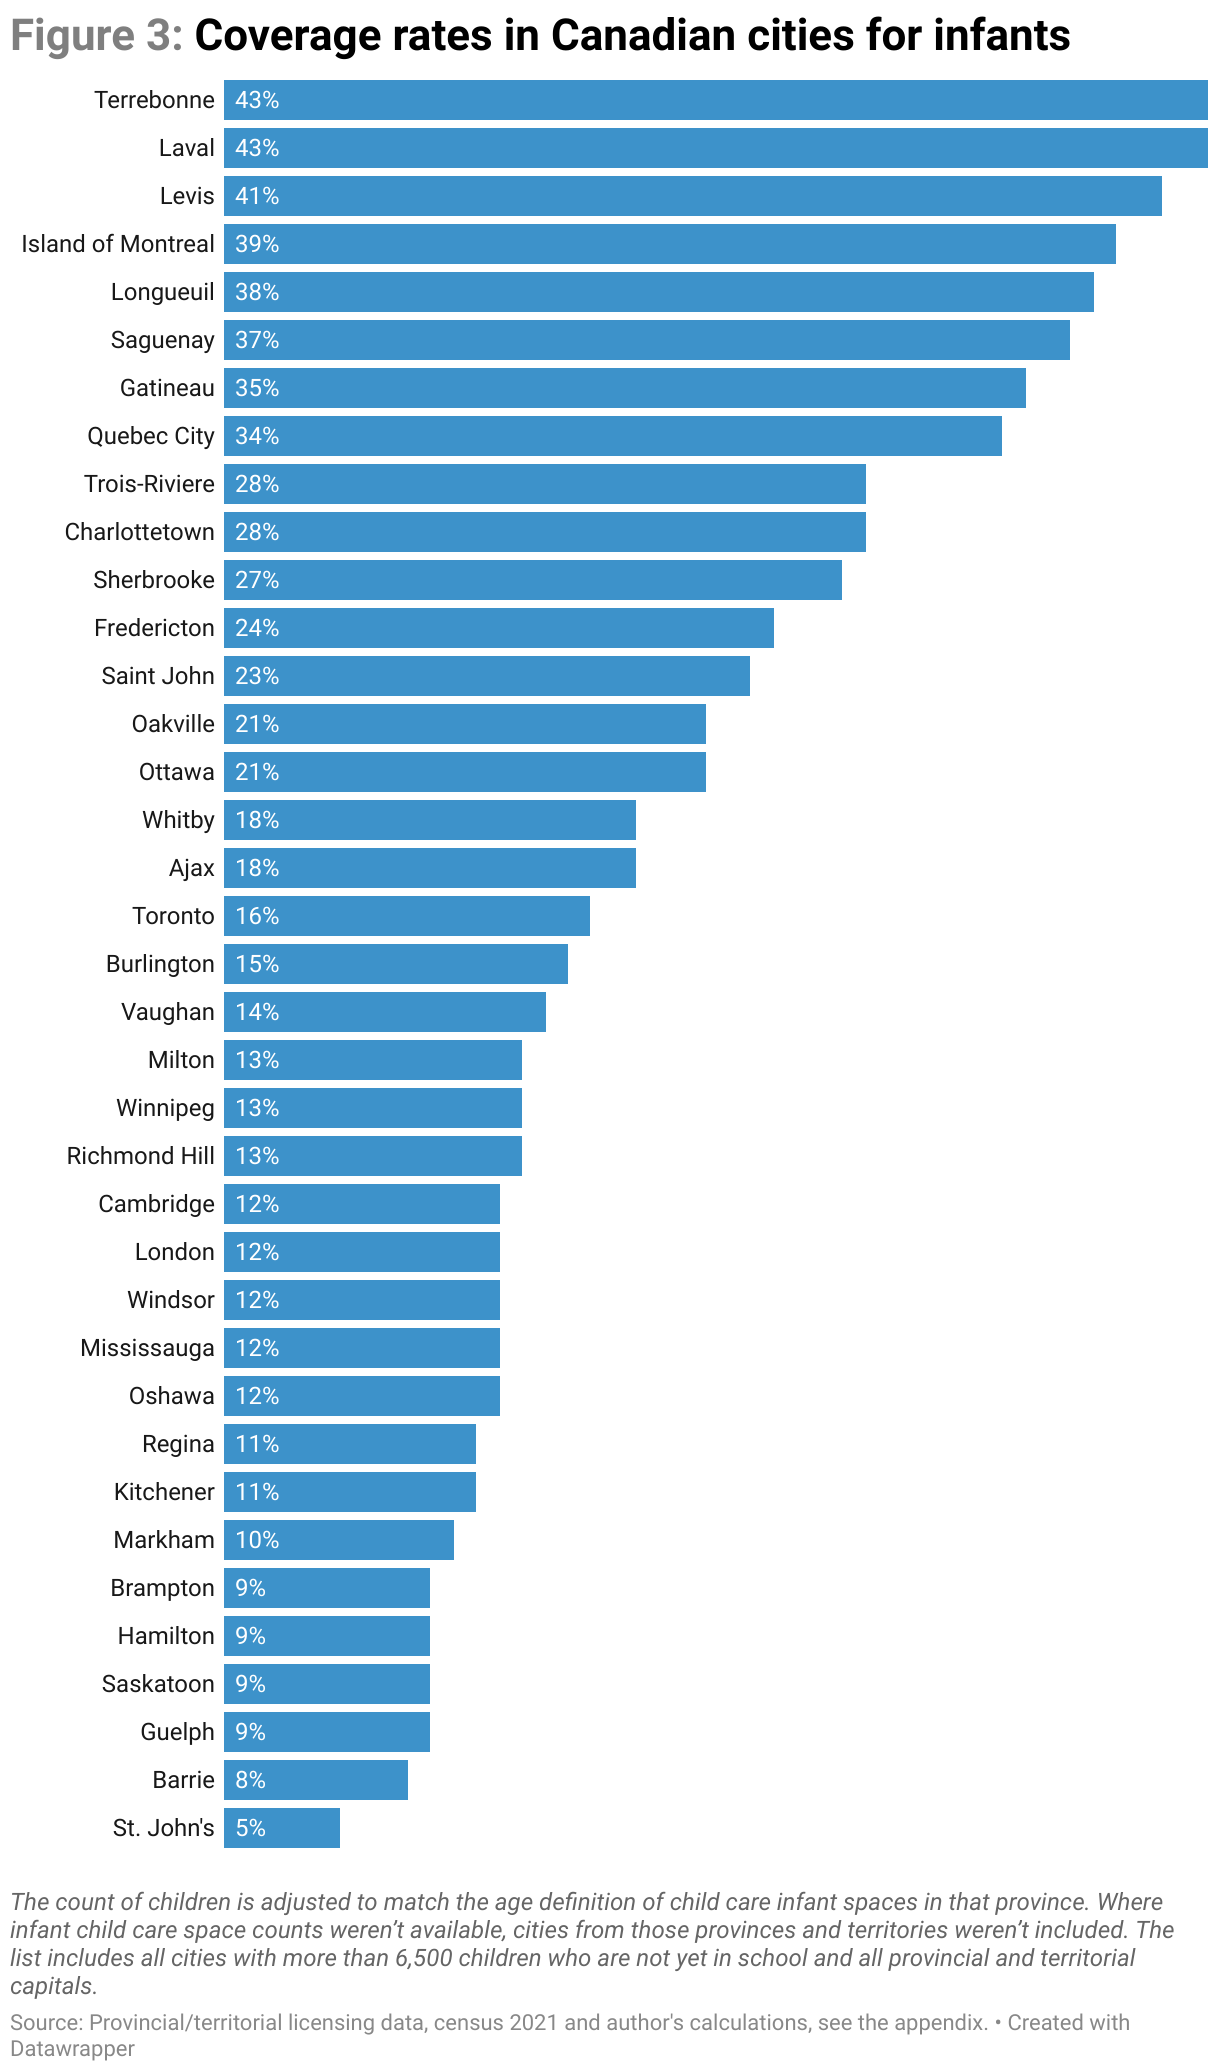
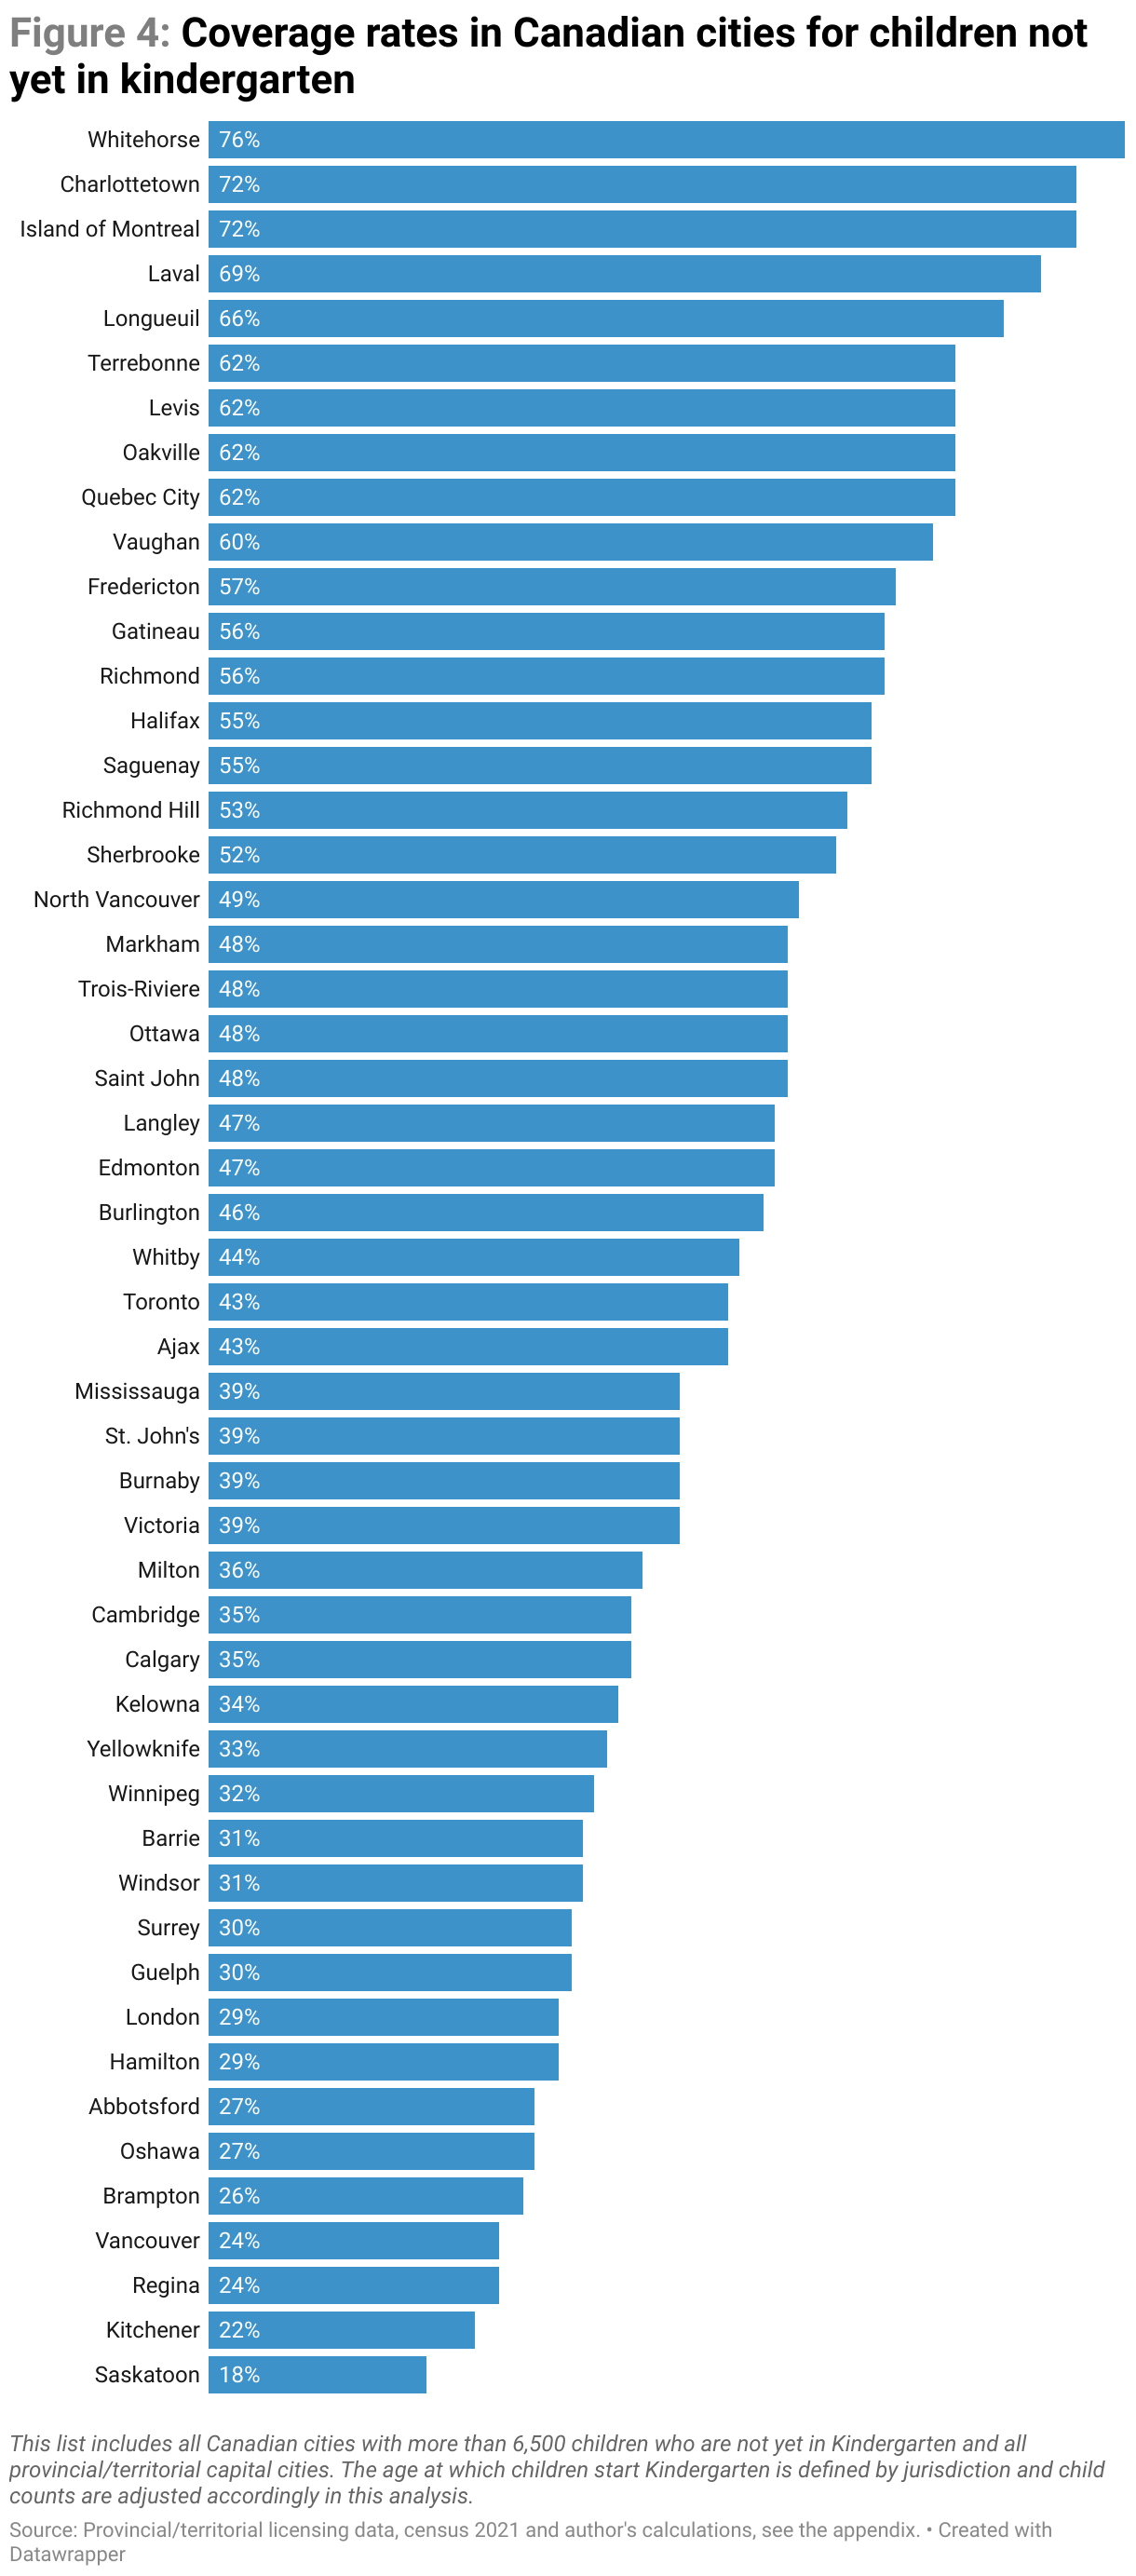
Figure 4 looks more broadly at the coverage rate for all children who are not yet in Kindergarten—that is, approximately 0–4 or five years, not just infants. B.C. and Alberta cities are included here. We are looking at cities (census subdivisions), not the larger regions or Census Metropolitan Areas (CMA).
Looking at child care deserts in this way, the cities with the best coverage rates are Whitehorse, Charlottetown and the island of Montreal, where there are roughly seven licensed spaces for every 10 children who are not yet in Kindergarten. At the bottom of the scale, we find Saskatoon, Regina, Kitchener and the City of Vancouver. In each one of these cities, there are roughly two licensed spaces for every 10 children, equating to coverage rates just over 20 per cent.
Comparing cities at the top of the list to those at the bottom: it is roughly three times easier to find a licensed child care space in the top-ranking cities compared to the bottom ranked cities. Among the top 10 cities, six are in Quebec, two are in Ontario and there is one each in the Yukon and Prince Edward Island. Among the bottom 10 cities, six are in Ontario, two are in Saskatchewan, and two are in British Columbia.
Expansion is critical, but the “how” matters
To eliminate child care deserts and achieve universal access, the child care system must be urgently expanded. But how?
Expansion of a child care service requires four things:
- Funding (someone needs to pay for it).
- Planning (someone needs to figure out where and how to build it).
- Delivery (someone needs to operate the service).
- Accountability (someone needs to ensure goals are being met).
Societies must decide how much to rely on each of: the state (public), the market, or civil society (the “third sector”) to do each of those things.
From our perspective, it is best to use an evidence-based approach, based on the experience of jurisdictions that have relied on the state, the market, and civil society in different amounts to do the four main things necessary for expansion, above.
Taken together, the evidence in Canada, and internationally, makes the argument for much more public involvement—a leadership role—in each of the four areas to achieve universal coverage in an early learning and child care system that is affordable, high quality, accessible and inclusive, and equitable, in which early childhood professionals are compensated fairly for their work.
Funding (who pays for it, and how?)
Canada has decades of experience showing that relying on private funding (parent fees, for-profit capital, not-for-profit donations/charity) does not organically produce equitable, high-quality, affordable, broadly available and inclusive child care systems. In short, if it could have, it would have long ago. That’s why Canada’s federal, provincial and territorial governments have committed a historic amount of public funds to finally build a universal child care system, aiming to cap parent fees at an average of $10 a day.
Canadian and international evidence also shows why funding child care systemically by publicly supporting services rather than funding individual parent-consumers is best policy practice. Here again, agreements shaping the federal/provincial/territorial early learning and child care initiative send public funding to child care services, not to parents.
Planning
The findings in this analysis show the uneven distribution and limited capacity of Canadian child care coverage. This has been achieved by relying on a privatized, unplanned approach to establishing services, so they “pop up” if an individual or group takes the initiative. Again, drawing on Canadian and international evidence and experience, both positive and negative, it is evident that this does not work to develop universal, equitable child care systems.
Planning—in the sense of community or urban planning of public goods—is a public government function. Governments must lead in planning child care expansion. Key elements of publicly planned child care systems include supply and demand analysis, design standards, multi-year capital plans with inherent priority setting, construction oversight, and workforce recruitment and retention strategies (such as publicly funded and competitive wage grids).
Responsibility for ensuring that public plans for child care expansion are formulated and implemented must be taken by the provincial/territorial governments, which are responsible for child care provision under Canadian constitutional arrangements. On a day-to-day basis, urban/community planning is ordinarily a municipal function, but municipal planning is not ordinarily done in isolation; it is done through consultations with key external partners and stakeholders.
In the new reality of federal government funding and Canada-wide commitments to child care expansion, without a coherent, publicly managed system of public planning, the build out of additional services will continue to be haphazard, driven by the relatively narrow fields of view of private providers who may have limited capacity for the task of designing and executing the expansion themselves. Planning processes for equitable expansion have not been built into federal/provincial/territorial agreements, although targets and priorities have been included in the agreements and action plans.
Delivery (who operates the child care?)
To turn this historic public investment into actual child care provision that meets parents’ and children’s needs means considering the possible delivery options—public, not-for-profit and for-profit operation. Canada has experience with all three; coverage is primarily not-for-profit, with most of the remainder consisting of for-profit and a small number of publicly operated services.
What has been learned from our own experience? We know for-profit ownership is associated directly and indirectly with multiple factors that are linked to poorer program quality, including lower wages, poorer working conditions, fewer ECE trained staff, more staff turnover, less compliance with regulations.
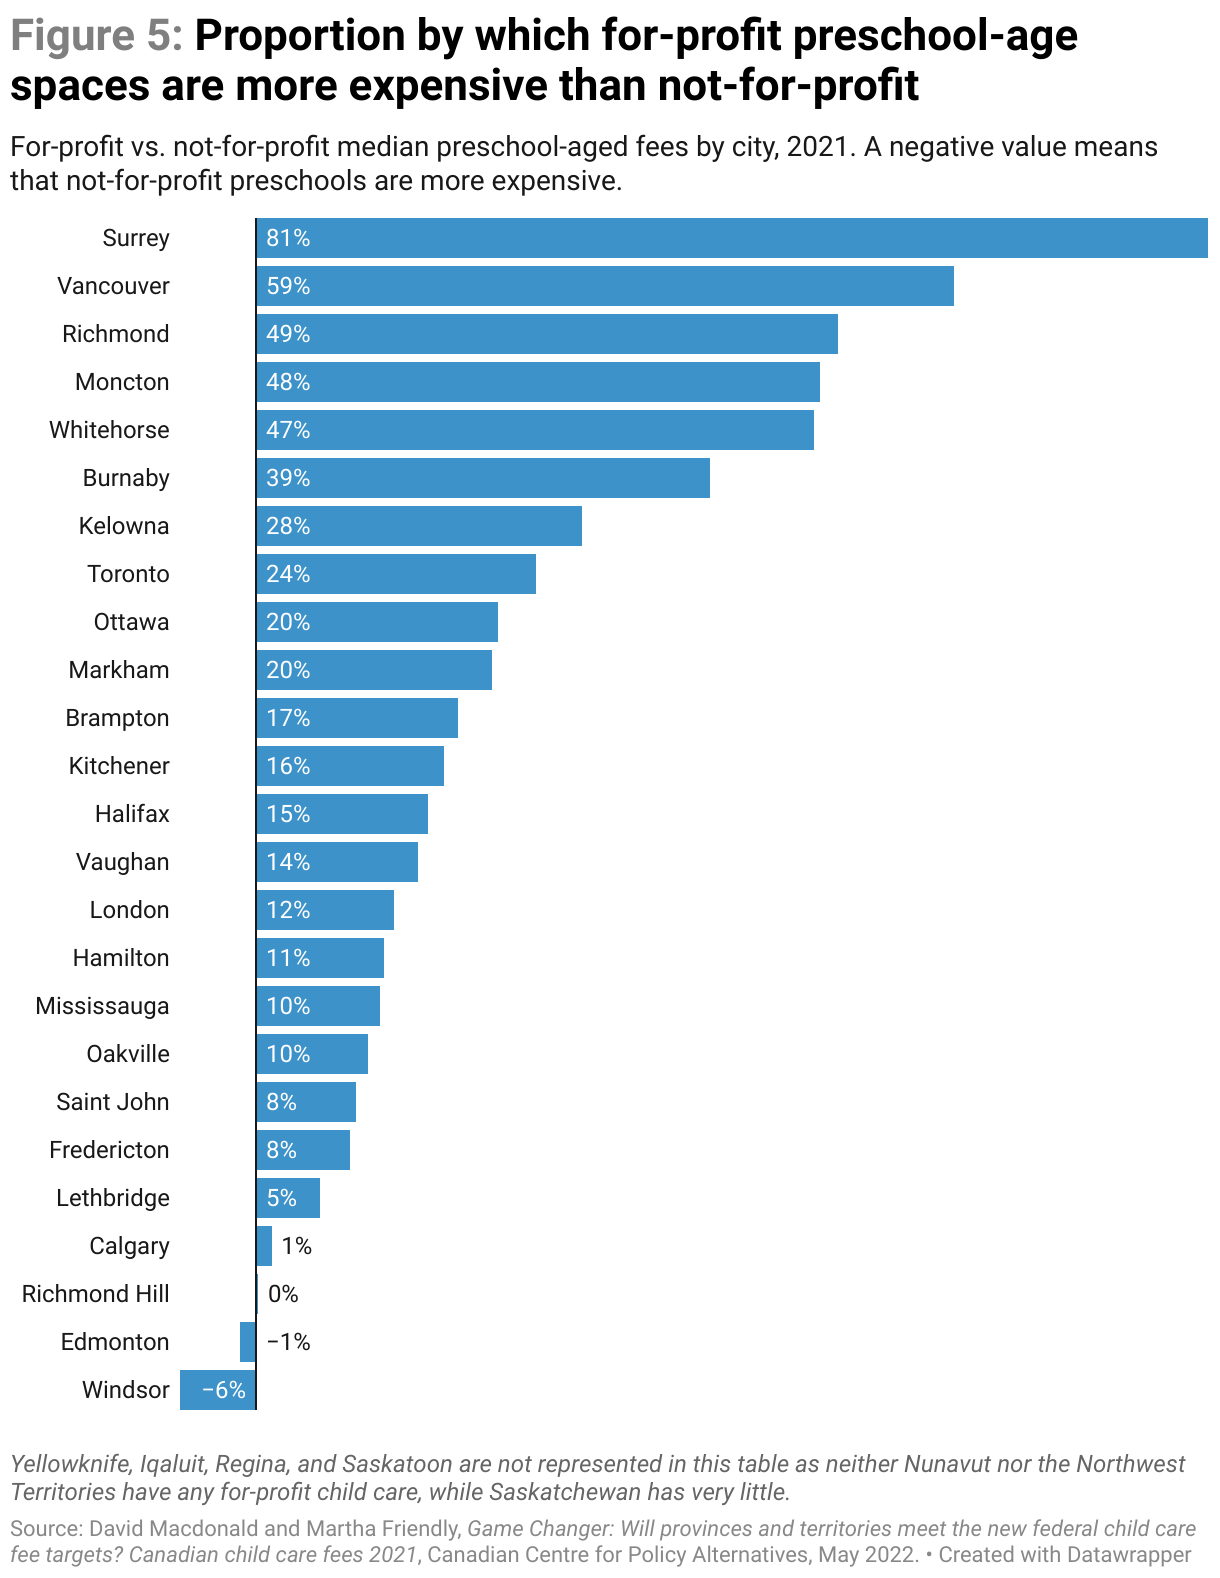
For-profit centres are also likely to charge higher parent fees, as successive CCPA annual fee surveys show. In 2021, just prior to Canada-wide national efforts to reduce parent fees began, there was a marked difference in the fees that not-for-profit and for-profit centres charged. In almost every city, median preschool aged fees were the same or more expensive among for-profits than not-for-profits—sometimes by wide margins, especially in B.C. and Ontario cities, as Figure 5 shows. For example, in Mississauga, median preschool-age fees in not-for-profit centres were $1,135/month in 2021, but they were $1,254 in for-profit centres.
International research backs up the Canadian experience with additional research and comparative analysis. It also illustrates how jurisdictions in which for-profit operators have become dominant have seen much of their public funding find its way into the accounts of private equity owners rather than being used for its intended purposes.
Around the world, countries that have achieved high-quality universal child care have largely anchored expansion in public provision, usually managed by the local level of government. These often include a voluntary or charitable non-profit sector and many—even in the most fully developed system—also allow some for-profits. There are usually publicly managed cost controls built in, such as publicly set fees and specified wages negotiated through collective bargaining. Nevertheless, even in a country with well-developed child care like Norway, the challenges that a shift to more for-profit ownership presented had moved the main early childhood educators’ union to take a position against the increased privatization of child care, which they view as a “threat to equitable education and governance by elected institutions.”29
In Canada, the federal government has stipulated—and most provinces/territories have agreed—that although existing for-profit operators may receive new public funding under the same terms as public and non-profit services, expansion will be “primarily public and not-for-profit.”
This is appropriate and should be strengthened. While for-profit models can be excellent at delivering a wide range of goods and services in society, the evidence consistently suggests that child care is not one of these, and for-profit child care expansion should be minimized.
Accountability
A final aspect of service expansion is perhaps most obviously best ensured by governments, which are democratically accountable for the stated goals of the promised universal child care system (affordability, quality, access, inclusion, and fair compensation of educators). Market-based accountability is weak in the child care sector due to the lack of competition/supply constraints and/or insufficient transparency and mobility. Accountability in the not-for-profit space (via mission-driven boards of directors) will be of varying strengths from provider to provider and inconsistent at a system level.
As public funding for child care in Canada has grown and will continue to dramatically grow as the accessible system is built, clear and transparent accountability for the uses and results of the substantial public funding will appropriately come from federal/provincial/territorial governments. Democratic governments face public risk when large sums of public money are not subject to scrupulous public accountability measures. Early learning and child care should be built in a way that is an asset, not a risk, to governments that invest in it.
In summary, to eliminate child care deserts and build a truly universal, high quality and equitable system, all four aspects of service expansion are best led by public institutions, with not-for-profit services providers and civil society at all levels as active and valued partners throughout. Early learning and child care is a public good—not a commodity and not a luxury. It must be available and accessible on a regular and consistent basis.
Conclusion and recommendations
By the beginning of 2023, most parents with young children will have noticed a substantial reduction in child care fees. This will certainly help with the strained household budgets of those young families who are lucky enough to be accessing a high-quality licensed child care space. The choice to dramatically reduce child care fees is a necessary one. It’s not only a pocketbook issue that people can get behind, but also a fundamental element of creating a widely accessible and equitable child care system. But the Canada-wide early learning and child care project is about more than parent fees; it must also include the other initiatives that are critical to the proper implementation of the overall project.
As this analysis shows, the availability of a child care space for young children is highly variable Canada-wide. It shows in some detail that child care deserts are a feature of child care provision all across Canada. This reality, which has developed over time as Canada lacked a unifying early learning and child care policy and funding, suggests that purposeful and rational expansion of licensed child care is a critical next step to ensure that all Canadian families can access more affordable fees. From many perspectives, supporting, facilitating and monitoring the impact of $10-a-day child care needs to be a collaborative effort by federal, provincial, territorial, Indigenous representatives, together with civil society, child care community partners, and parents in order to maximize success.
All provinces and territories have set out expansion targets in their agreements30 with Ottawa. In their first action plans, most have identified priorities for expansion and some have begun to craft concrete expansion plans.31 The next step is to begin to focus on, reinforce and heighten these initiatives, highlighting efforts to ensure that affordable child care spaces are expanded and operationalized as an integral part of building an adequate supply of “primarily public and not-for-profit” early learning and child care from coast to coast to coast.
Creating an adequate supply of licensed quality spaces to meet demand was one of the big challenges for Quebec when it implemented its (then) $5 a day child care plan in the 1990s. Parent fees certainly fell with the introduction of provincially set fees, but without a significant expansion in public or not-for-profit spaces to cover the substantial increase in demand, a rapid expansion in the for-profit sector of lower quality32 spaces followed.33 The absence of an adequate supply of not-for-profit spaces continues to be a problem in Quebec child care today, leading to warnings that this scenario is something that should be avoided this time around.
Many of the benefits of lower child care fees can only be fully realized if the newly created demand can be met with a much improved supply of licensed spaces. For example, higher women’s labour force participation that can yield both stronger economic growth as well improved tax revenue34 as more people work can only happen if there are more licensed spaces. That is, more parents can work only if there is an enhanced supply of quality licensed child care for their children.
Not surprisingly, most provinces/territories have a long way to go to make their lower-fee child care available to most parents and, as all evidence shows, child care expansion isn’t something that can simply be left to the “market” if we don’t want to perpetuate inequitable access. Much more public planning and public management will be required to ensure a more impactful approach.
This paper has focused heavily on the availability and location of licensed child care. But, as we pointed out in the introduction, it’s critical to ensure that child care is about location and capital funding as well as the qualified child care workforce needed to staff the newly expanded, renovated or built child care facilities. Without the staff, child care is just an empty building, so the issue of the child care workforce must be addressed without delay.
According to commitments from senior levels of government, by 2025–26, parent fees in licensed child care fees will be much more affordable, in line with commitments to $10-a-day child care. That promise will be limited to the lucky few if rapid space expansion isn’t immediately pursued.
Recommendations
1. Set clear targets and criteria for all aspects of expansion, including geographic access, but also set clear targets and criteria for inclusion, facility quality, program frameworks and educator qualifications.
2. Address the current, rate-limiting and critical shortage of early childhood educators through implementation of publicly funded wage grids that guarantee decent wages for all early childhood educators, including other benefits.
3. Develop publicly led, proactive, multi-faceted, multi-year plans in each jurisdiction, taking into account specific regional and local conditions and needs. Consider using multiple methods of expansion, with plans that are informed by local input and rigorous geographic supply and demand analysis—funded through a multi-year capital plan.
4. Drive much more expanded child care delivery through the creation of new, high-quality public services. Consider options for a public entity to serve as the lead body and as the local lead bodies for implementation.
5. Make public funds available for not-for-profit child care in new or expanded facilities, as well as old facilities that are under public ownership or that include clauses guaranteeing transfer of ownership/recoupment of public investment upon dissolution. Ensure these capital grants support high-quality facilities that are environmentally healthy, climate resilient and low-carbon.
6. Support the not-for-profit sector’s ability to expand through planning grants and other resources (e.g. template facility designs).
7. Do not spend public funds on expansion of for-profit child care in terms of new buildings or funding for additional spaces. Public operational grants should be given to existing for-profit child care providers in order to lower parent fees and raise educators’ wages. Governments must also ensure that these grants are associated with absolute caps on fees and fee increases, including accountability mechanisms to avoid retroactive wage cuts, public funds flowing into private real estate, and additional exclusionary fees charged to families.
Methodology

Data sources by province
Newfoundland and Labrador
The government website provides a complete list of licensed centres, including address, broad age range and total count of licensed spaces.35 A separate map of licensed family child care agencies36 is available, including the number of homes that an agency is licensed for. Both of these data sources were scraped.
The online centre list does not contain a detailed breakdown of licenses by a child’s age. In January 2023, the Department of Education provided licensed capacity counts by FSA for the following age categories: infant, toddler, toddler/preschooler, preschool, preschool/school and toddler/preschool/school. While an infant/toddler license category exists, no centres are presently licensed for it.
All of these categories were summed up to produce a count of licensed spaces for each FSA. The infant-only age was used in the infant sections of this report. Some of those spaces could be for school-age children, which we want to exclude, but there is no way to do so based on the licensing data. As such, coverage rates in the province are likely overestimates.
Homes are assumed to have one infant and three other children who aren’t yet in Kindergarten. Agencies declare the areas in which they operate. Those areas are converted to FSAs and spaces are allocated to FSAs based on relative populations of children not yet in Kindergarten.
New Brunswick
A complete list of licensed centres and individual homes is available through a provincial website.37 Address, total capacity, the list of age licenses and full-time/part-time status are available here. This data was scraped.
The online list does not contain the detailed breakdown of licensed capacity by age. In January 2023, the Education and Early Childhood Development Agency provided a detailed breakdown of licensed capacity by infants and other spaces for children who are not yet in Kindergarten.
Individual home addresses are available from the online list, providing the requisite FSA. Homes are assumed to have one infant and three other children who aren’t yet in Kindergarten.
Prince Edward Island
Two sources of child care licenses are available in the province. The first is the directory of licensed centres and homes.38 The second is the P.E.I. Early Learning and Child Care registry,39 which is affiliated with the government but operates separately as a means for parents to search for and register for child care. The registry does not necessarily include all centres and homes because a sign up on their part is required. Neither online source has counts of licensed spaces, although they do have addresses and the age range served.
In January 2023, the Department of Education and Lifelong Learning provided a complete list of centres and homes with detailed licensing counts for infants and other spaces for children who are not yet in Kindergarten. Homes are assumed to have one infant and three other children who aren’t yet in Kindergarten.
Nova Scotia
The province provides a complete list of licensed child care centres and home agencies through an open data portal, which was downloaded in December 2022.40 The list contains centre addresses, total licensed capacity, full-time/part-time status and the presence (but not the count) of infant, toddler and preschool spaces.
While the Department of Education and Early Childhood Development does specify capacity limits by age group, that data isn’t readily machine readable and wasn’t available at the time of publication. As such, if a centre indicated the presence of infant, toddler or preschool spaces, the entire total licensed capacity was included. This will tend to overestimate the count of spaces since centres also have school-age spaces, which will make up some portion of the total licensed capacity. Unfortunately, those could not be accurately excluded.
While the main online list did contain all home agencies, it did not contain the number of homes that each agency was licensed for. The licensed home counts were obtained either from agency websites or through phone calls. Homes are assumed to have one infant and three other children who are not yet in Kindergarten. The counties served were converted into FSAs, with homes assumed to have one infant and three other children who aren’t yet in Kindergarten. These spaces are distributed to each FSA in proportion to the children living there who aren’t yet in Kindergarten.
Quebec
A complete list of child care centres is available and was downloaded in December 2022.41 The licensed counts for infants and other children who are not yet in Kindergarten are directly available, as is the address for each centre. Licenses don’t distinguish between full-time and part-time spaces, therefore, all spaces are included.
Home agencies are available separately and were screen-scraped.42 The online list provides the count of licensed homes for each agency. The FSAs served by each agency were determined from the territories and municipalities served by that agency. Homes are assumed to have one infant and three other children who aren’t yet in Kindergarten. These spaces are distributed to each FSA in proportion to the children living there who aren’t yet in Kindergarten.
Ontario
A complete list of all licensed child care centres and home agencies was scraped in November 2022 from the province’s online search.43 The site provides centre addresses and detailed license counts for infants, toddlers and preschoolers.
Home-agency licensed house counts are available, as are the areas served by each agency. Areas served were converted into FSAs. Homes are assumed to have one infant and three other children who aren’t yet in Kindergarten. These spaces are distributed to each FSA in proportion to the children living there who aren’t yet in Kindergarten.
Centres with names containing “nursery school” are removed since these represent part-time spaces.
Manitoba
A complete list of licensed child care centres and individual homes was screen-scraped in December 2022 from the province’s child care search page.44 The website contains centre addresses, maximum child counts and general age ranges. The text of the individual centre licenses is also available and, through this, detailed age disaggregated license counts are obtained. Some licenses specify children under age 5 or age 6. This could easily include school-age children, but there is no way to disaggregate them further, so those full counts are included. This will tend to overestimate the count of licensed spaces.
Nursery schools are excluded since these are part-time programs.
The search website contains individual home addresses for most sites. Some home addresses were suppressed due to privacy concerns, but the FSA was still available in almost all cases. Homes are assumed to have one infant and three other children who aren’t yet in Kindergarten.
Saskatchewan
The province maintains a search website containing a complete list of licensed child care centres and individual homes, which was scraped in January 2023.45 This website provides addresses, age range of licenses, but does not provide licensed counts.
In December 2022, the Ministry of Education provided detailed license counts for infants, toddlers and preschoolers.
Homes are assumed to have one infant and three other children who aren’t yet in Kindergarten.
Alberta
The provincial child care search website was scraped in December 2022.46 The website lists all licensed child care centres, home agencies and individual homes. The address and total licensed capacity are available. Search criteria can limit the centres to only those offering full-time spaces, i.e. the type of program is “daycare”. The age groups served can also be limited to only those offering infant and/or 19 months to Kindergarten spaces. Centre names that imply only part-time care, like “before school”, “after school” or “out of school” are excluded. Further age assessment isn’t possible and so the total license capacity of centres that meet those criteria are included. This will tend to overestimate the count of licensed spaces for younger children since some school-age spaces will be included.
Individual homes have listed addresses and are assumed to have one infant and three other children who aren’t yet in Kindergarten.
The province also licenses home agencies and provides total space counts for the entire agency, but not a count of licensed homes. It is assumed that the total space count divided by 10 will yield the count of licensed homes. Then each home is assumed to have one infant and three other children who are not yet in Kindergarten. The FSAs served by each agency are obtained by individually searching each FSA in Alberta and determining which agencies serve it. Licensed spaces are distributed to each FSA in proportion to the children living there who aren’t yet in Kindergarten.
British Columbia
While the province maintains a province-wide map and search function,47 the counts of licensed spaces aren’t available, nor does it include all centres. In B.C., child care is licensed through the five health regions and each maintains a separate website. This data was downloaded in December 2022.
Homes are licensed individually in B.C. The “family child care” and “in-home multi-age childcare” licenses are considered homes in this report. Homes are assumed to have one infant and three other children who aren’t yet in Kindergarten.
The “child-minding”, “occasional child care”, “preschool (30 months to school age)” and “group child care (school age)” centre license counts are excluded. The “multi-age child care” is flexible for any age and is included in counts in this report.
1. Fraser health region
PDF files exist for each of the sub parts of the Fraser health region.48 These contain a complete list of licensed child care centres and individual homes. If the maximum child count in a centre exceeds the sum of the counts of the individual age licenses, then the age licenses are proportionately adjusted downwards.
2. Island health region
The December 2022 licensed facility list was downloaded.49 It provides addresses of all centres and homes along with license counts by facility.
3. Vancouver coastal health region
The inspections and licenses for all homes and centres are available on the region’s facility disclosure page.50 Each individual age license count is registered separately even if they are at the same physical location.
4. Interior health region
The inspections and licenses for all homes and centres are available on the region’s facility disclosure page.51 The individual license age counts are contained in the “opening comments” for each inspection.
5. Northern health region
Inspection reports can be used to create a list of all licensed centres and homes.52 Sometimes individual age license counts are available but, generally, only maximum capacity for the centre is available. The license types by centre are known. Any “310 multi-age” license is assumed to have eight spaces, as is common throughout the province. The remainder of the total centre capacity is equally distributed among the license types for that centre.
Nunavut
In January 2023, the Department of Education provided a list of all licensed child care centres and individual homes, with addresses and detailed age licensing information. An online list isn’t presently available. Preschool and head start programs are generally part-time and were excluded.
Homes are assumed to have one infant and three other children who aren’t yet in Kindergarten.
Northwest Territories
A complete list of licensed child care centres and individual homes is available through the Department of Education, Culture and Employment.53 This provides location but not the licensed count, either in the aggregate or by detailed age group. Due to privacy rules, the ministry wasn’t able to share space counts by centre, nor aggregate results to the FSA level.
However, the data was still available from our 2018 report. Combined with updated information from our annual fee survey and supplementary phone calls, detailed license counts by age were compiled.
Homes are assumed to have one infant and three other children who aren’t yet in Kindergarten.
Yukon
The territory’s “find child care” website lists all licensed centres and individual homes.54 This data was downloaded in December 2022. This list provides addresses, total space count and age range for each centre. Any centre whose youngest age group served was in Kindergarten was excluded. Most licenses included basically age types and this is generally sufficient for proper counts, although centres can flex spaces between their general age ranges. In some cases, additional data was obtained through phone calls and data from our 2021 fee survey.
Homes are assumed to have one infant and three other children who aren’t yet in Kindergarten.
Notes
- For a recent study on the importance of ECE training, see Hentschel, Tran, Nguyen, Tran & Yousafzai, 2023. https://doi.org/10.1016/j.childyouth.2023.106844
- Childcare Resource and Research Unit, Moving from private to public processes to create child care services in Canada. A series, Childcare Resource and Research Unit, Paper 1, pg. 2, 2022.
- Organisation for Economic Co-operation and Development (OECD), Canada Country Note, Thematic Review of Early Childhood Education and Care, OECD Directorate of Education, pg. 173, 2004.
- See, for example, National Association for the Education of Young Children (USA), https://www.naeyc.org/resources/pubs/yc/nov2015/emergent-curriculum.
- Note that even setting up a regulated family child care home has capital funding requirements, although numerically, regulated family child care plays a relatively small role in Canadian child care supply.
- See M. Friendly, R. Vickerson, S.S. Mohamed, L. Rothman and N.T. Nguyen, Risky business: Child care ownership in Canada past, present and future, Toronto: Childcare Resource and Research Unit, 2021.
- B. Petersson, R. Mariscal, and K. Ishi, Women are key for future growth: Evidence from Canada, International Monetary Fund Working Paper, 2017.
- David Macdonald, Child Care Deserts in Canada, Canadian Centre for Policy Alternatives, June 2018, https://policyalternatives.ca/publications/reports/child-care-deserts-canada.
- S. Prentice and L.A. White, “Childcare deserts and distributional disadvantages: the legacies of split childcare policies and programmes in Canada,” Journal of International and Comparative Social Policy, pg. 1–14, 2018, https://doi.org/10.1080/21699763.2018.1526700.
- The census variables beyond population counts for 2021 at the FSA level are available here: https://www12.statcan.gc.ca/census-recensement/2021/dp-pd/prof/details/download-telecharger.cfm?Lang=E.
- For further details about provincial/territorial Kindergarten programs and child care coverage, see J. Beach, M. Friendly, N.T. Nguyen, P. Borges Nogueira, M. Taylor, S.S Mohamed, L. Rothman and B. Forer, Early Childhood Education and Care in Canada 2021, Childcare Resource and Research Unit, 2023.
- R. Vickerson, M. Friendly, B. Forer, S.S. Mohamed, and T. Nguyen, One year later: Follow up results from a survey on COVID-19 and child care in Canada, Toronto: Childcare Resource and Research Unit, January, 2022.
- David Macdonald and Martha Friendly, Game Changer: Will provinces and territories meet the new federal child care fee targets? Canadian child care fees 2021, Canadian Centre for Policy Alternatives, May 2022.
- J. Beach, M. Friendly, N.T. Nguyen, P. Borges Nogueira, M. Taylor, S.S Mohamed, L. Rothman and B. Forer, Early Childhood Education and Care in Canada 2021, Childcare Resource and Research Unit, 2023.
- Early childhood educators of B.C., media release, “Findings from the recent report Evaluation of Early Care and Learning Recruitment and Retention Strategy in British Columbia are now available,” January 11, 2023, https://www.ecebc.ca/news-events/labour-market/media-release-findings-recent-report-evaluation-early-care-and-learning-recruitment-and-retention-strategy-british-columbia-are.
- British Columbia also has a category named “Registered license-not-required,” which is the B.C. term for regulated family child care homes registered with a local Child Care Resource and Referral.
- Rasheed Malik, Katie Hamm, Leila Schochet, Cristina Novoa, Simon Workman, and Steven Jessen-Howard, America’s Child Care Deserts in 2018, Center for American Progress, December 2018, https://www.americanprogress.org/article/americas-child-care-deserts-2018/.
- Rasheed Malik, Katie Hamm, Won F. Lee, Elizabeth E. Davis, and Aaron Sojourner, The Coronavirus Will Make Child Care Deserts Worse and Exacerbate Inequality, Center for American Progress, June 2020, https://www.americanprogress.org/article/coronavirus-will-make-child-care-deserts-worse-exacerbate-inequality/.
- Rasheed Malik, Won F. Lee, Aaron Sojourner, and Elizabeth E. Davis, Measuring Child Care Supply Using the Enhanced Two-Stage Floating Catchment Area Method, The Centre for American Progress, June 2020, https://cdn.americanprogress.org/content/uploads/2020/06/18081719/Child-Care-Deserts-Methodology.pdf.
- This 20-minute drive approach is interesting to consider in comparison to the popular idea of the 15-minute city, an urban concept assuming that most things necessary on a daily basis, such as school, work, shopping, recreation, etc., should be available with a 15-minute walk or bike ride.
- Plantenga, Scheele, Peeters, Rastrigina, Piscová and Thévenon, Barcelona Targets Revisited: Compilation of briefing notes, Directorate General for Internal Policies, Policy Department C: Citizens’ Rights and Constitutional Affairs, November 25, 2013, http://www.europarl.europa.eu/RegData/etudes/workshop/join/2013/493037/IPOL-FEMM_AT(2013)493037_EN.pdf.
- Plantenga, J. Scheele, A., Peeters, J., Piscová, O. Thévenon, O., Barcelona Targets Revisited, European Union. Directorate General for Internal Policies, 2013.
- In this report, an FSA with fewer than 50 young children is excluded from any FSA or desert calculations.
- Martha Friendly, Laura Feltham, Sophia S. Mohamed, Ngoc Tho Nguyen, Rachel Vickerson, Barry Forer, Early Childhood Education and Care in Canada: 2019, Childcare Resource and Research Unit, Table 25, pg. 242, December 2020, https://childcarecanada.org/publications/ecec-canada/20/12/early-childhood-education-and-care-canada-2019.
- See The Long View: Table 3 of Childcare Resource and Research Unit, Early childhood care and education in Canada: Provinces and territories 1998, pg 121, July 2000, https://childcarecanada.org/publications/ecec-canada/00/07/ecec-canada-provinces-and-territories-1998.
- M. Friendly, C. Ferns, B. Grady, and L. Rothman, Child care can’t wait till the cows come home: Rural child care in the Canadian context, Occasional Paper No. 30, Childcare Resource and Research Unit, 2016, https://childcarecanada.org/sites/default/files/Occasional%20paper%20No.30.pdf.
- The term “donut city” is sometimes used to mean a city with a deteriorated centre and rapid growth of surrounding suburbs.
- By cities, we’re using the Statistics Canada Census Subdivision (CSD) definitions and names. A FSA will be in a CSD if the majority of the underlying full postal codes are in that CSD. Any FSA with the middle character of a zero, designating a rural postal code, is excluded from being part of a city.
- See More than spaces: Creating universal child care in Norway, 2022 and Moving from private to public responsibility. A series on creating child care in Canada, paper 8, Childcare Resource and Research Unit.
- See https://www.canada.ca/en/early-learning-child-care-agreement/agreements-provinces-territories.html.
- See a summary of the provincial/territorial agreements and action plans at https://childcarecanada.org/publications/other-publications/22/11/summary-canada-wide-early-learning-and-child-care-agreements.
- See C. Japel, Access and quality in Quebec’s for-profit child care: Learning from experience.
- See G. Cleveland, S. Mathieu and C. Japel, Policy Options, 2021.
- See R. Fortin, “Quebec’s child care program at 20,” In Inroads, 2021.
- Department of Education, “Child care centres by name search,” https://www.childcare.gov.nl.ca/public/ccr/childcare/?apply_table_filters=1&keyword=.
- Department of Education, “Early Learning and Child Care Directory Child Care Service Map Search,” https://www.childcare.gov.nl.ca/public/ccr/search/.
- Department of Education and Early Childhood Development, “Facility Search,” https://www.nbed.nb.ca/parentportal/en/search/elc/.
- Department of Education and Lifelong Learning, “Directory of Licensed Early learning and child care centres,” https://www.princeedwardisland.ca/en/publication/directory-of-licensed-early-learning-and-child-care-centres.
- P.E.I. Early Learning & Child Care Registry, https://peichildcareregistry.com/search.php
- Child care Directory, https://data.novascotia.ca/Education-Early-Childhood/Child-Care-Directory/3j9v-yimg.
- Ministère de la Famille, “Répertoires des services de garde par région administrative,” link répertoires des services de garde, https://www.mfa.gouv.qc.ca/fr/services-de-garde/parents/localisateur/Pages/liste.aspx.
- Ministère de la Famille, “Childcare centres, day care centres and home childcare,” https://geoegl.msp.gouv.qc.ca/mfa/recherche-region.php.
- Ontario Ministry of Education, “Find Licensed Child Care,” https://www.earlyyears.edu.gov.on.ca/LCCWWeb/childcare/search.xhtml.
- Department of Education and Early Childhood, “Manitoba Child Care Search,” https://childcaresearch.gov.mb.ca/.
- Ministry of Education, “Regulated Child Care Facilities in Your Community,” https://www.saskatchewan.ca/residents/family-and-social-support/child-care/find-a-child-care-provider-in-my-community.
- Department of Children’s Services, “Child Care Lookup,” http://www.humanservices.alberta.ca/oldfusion/ChildCareLookup.cfm.
- Government of British Columbia, “Child care Map,” https://maps.gov.bc.ca/ess/hm/ccf/.
- “Find a licensed child care facility near you,” Fraser Health, https://www.fraserhealth.ca/health-topics-a-to-z/child-care/find-a-licensed-child-care-facility-near-you.
- Island Health, “Child care list December 20, 2022,” https://www.islandhealth.ca/our-services/community-care-facilities-licensing/child-care-licensing.
- Hedgehog Disclosure, “Search Facilities,” https://inspections.vcha.ca/ChildCare/Table?SortMode=FacilityName&page=2&PageSize=50000.
- Interior Health, “Inspection Reports,” https://hedgehogportal.interiorhealth.ca/ChildCare/Table?FacilityCountLimit=0&ProgramAreaId=9715d3eb-4322-451e-b42e-0ee89db1c97e&ProgramAreaName=ChildCare&SortBy=FacilityName.
- Northern Health, “Public Health Protection,” https://www.healthspace.ca/Clients/NHA/NHA_Website.nsf.
- Department of Education, Culture and Employment, “Licensed early learning and child care programs directory,” https://www.ece.gov.nt.ca/en/childcare.
- Department of Education and Schools, “Find early learning and child care for Yukoners,” yukon.ca/en/education-and-schools/early-childhood-learning-and-programs/find-child-care-yukoners#day-care-centres.
Acknowledgements
Many thanks to provincial and territorial government officials who aided in the compilation of the underlying dataset. Thanks to Lynell Anderson, Morna Ballantyne, Jane Beach, Iglika Ivanova, Susan Prentice and Eric Swanson for their helpful comments on an earlier draft of this paper.