
Our content is fiercely open source and we never paywall our website. The support of our community makes this possible.
Make a donation of $35 or more and receive The Monitor magazine for one full year and a donation receipt for the full amount of your gift.
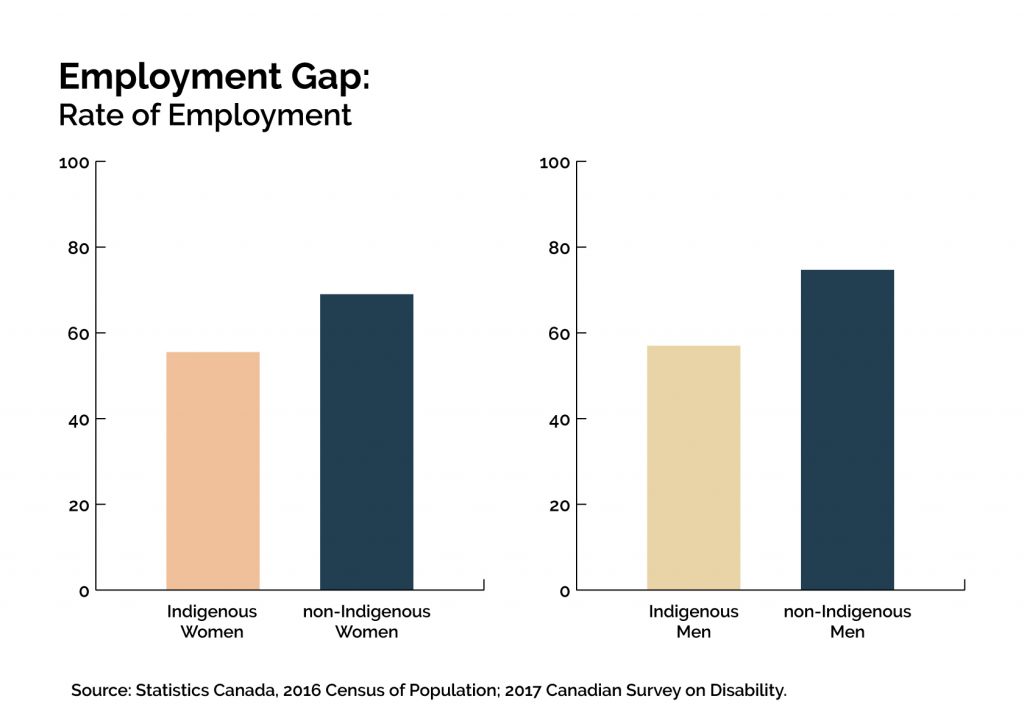
Statistics Canada (2016), Census of Population – selected publications. Employment rates are calculated for adults aged 25-64 years.
The Best and Worst Places to be a Woman in Canada report, now in its fifth update, provides a snapshot of the gaps that exist between women and men in Canada’s largest cities. It attempts to look beneath the national figures that dominate headlines to see at how women are doing in communities across the country on key issues such as the wage gap, intimate partner violence and their place at leadership tables.
The centrepiece of the project is a Gender Gap Index that combines 18 gender equality indicators and is calculated for 26 cities. It helps point to broader trends and inequalities that impact lives across the country. But much is missing from the local pictures presented.
No single measure or index can hope to capture the complexity of women’s lives or provide a definitive accounting of a city’s strengths and weaknesses with respect to gender equality. More fundamentally, there are significant data gaps in what we know about the experiences of different groups of women, differences that because of this lack of data cannot be factored into the Index—differences that end up being overlooked or ignored.
Not all women are the same, or experience the same things
We know, for example, that there are high levels of unmet needs among trans and gender diverse people. We know that immigrant women are more highly educated than Canadian-born women, but face significant employment barriers. We know that Indigenous women experience much higher levels of violence than non-Indigenous women. This is also true for women with disabilities.
But we don’t have a good sense of what is happening at the community level because—with the exception of the Census—there are few reliable, consistent or public data sources available for neighbourhoods or municipalities which disaggregate the population by gender identity, disability, racialized group or Indigenous status.
And in many instances, we simply don’t have any information at all. A recent series by The Globe and Mail provides a stark accounting of gaps in data on everything from the health outcomes of different racialized groups; to the housing needs of First Nation peoples living in urban centres; to the number of women who stay in violent relationships because they don’t have the means to leave.
All things being equal …
Our Gender Gap Index uses a limited number of statistics to point to broader social and economic trends and disparities that shape the lives of women and men.
All things being equal, we would expect that men and women would be employed in roughly the same numbers and earn approximately the same wages, that men and women would occupy an equal share of management jobs, that the same proportion of women and men would report high levels of stress in their daily lives.
But things are not equal – which is why tracking these key indicators is necessary, and especially so, for marginalized groups that experience the most significant barriers.
The 2016 Census gives us a sense of the scale of these disparities at the national level.
“We like to pretend we’re colourblind, which is very problematic, because we’re not colourblind and we’re not gender blind—we’re just blind at realizing that there is a problem and doing something about it.”
Dr. Onyenyechukwu Nnorom, University of Toronto
The Employment Gap
- Immigrant women’s employment lags 5.1 percentage points behind Canadian-born women and 12.2 percentage points behind that of immigrant men—all figures for the population aged 15-64 years. The gap was even larger among recent immigrants: just over half of the women (53.7%) who immigrated to Canada between 2011 and 2016 were employed in 2016 compared to 70% of Canadian-born women and 71.5% of new immigrant men.
- The employment gap between Indigenous women (55.5%) and Indigenous men (57%) is quite narrow, but the gap between Indigenous women and non-Indigenous women (69%) and men (74.7%) is considerably higher. This is also true among women with disabilities who report very low levels of employment (57.4%) compared to abled women(76.3%) and men(84.0%).
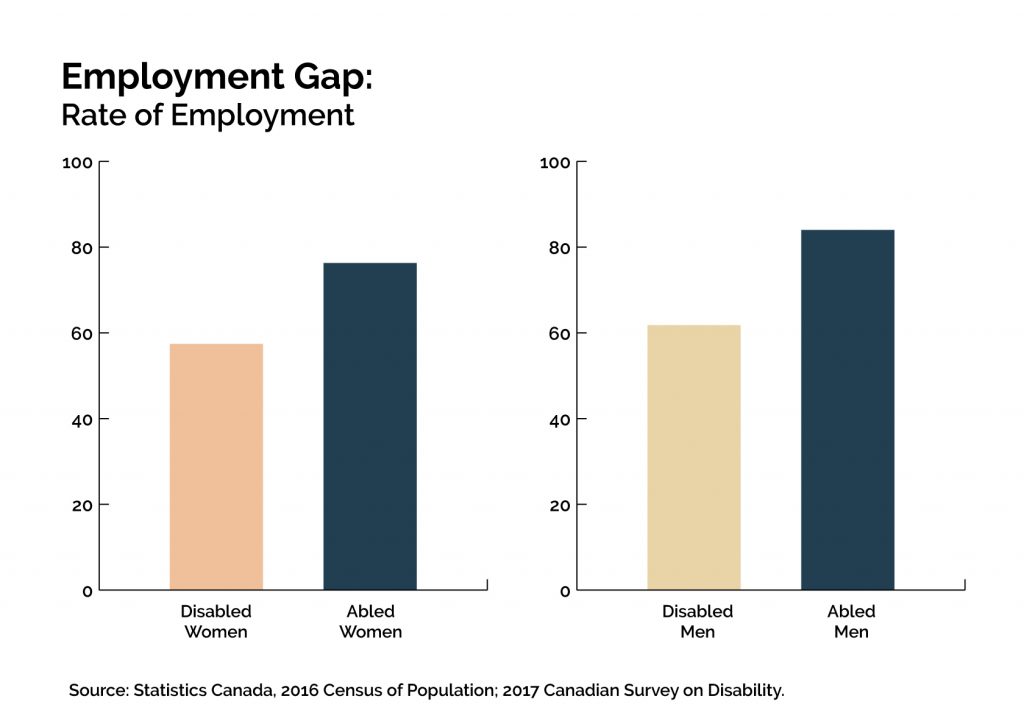
Figures on disability are based on the 2017 Canadian Survey on Disability, cited in Stuart Morris et al. (2018), “A demographic, employment and income profile of Canadians with disabilities aged 15 years and over, 2017.” Statistics Canada, Catalogue no. 89-654-X2018002. Employment rates are calculated for adults aged 25-64 years.
Statistics Canada (2016), Census of Population – selected publications
The Wage Gap
- Gaps in pay for women and racialized groups persist. On average, racialized men make only three-quarters (77.6%) of what non-racialized men make ($32,600 vs. $42,000), and racialized women make even less at $25,000 (59.5% of non-racialized men). My colleague, Sheila Block’s new study with Ryerson University’s Grace-Edward Galabuzi shows that, in Ontario, the wage gaps are deepest for women who identify as West Asian, Arab, Latin American and Southeast Asian.
- The size of the wage gap is also significant for Indigenous peoples. Average wages of Indigenous men are $9,400 less compared to non-Indigenous men. Indigenous women bring home $17,000 less than non-Indigenous men, and $7,800 less than Indigenous men.
- If those same Indigenous and racialized women had been making the same salaries as their white male peers, they would have added $43 billion more to Canada’s economy and their own bank accounts in 2015.
- These gaps aren’t just about hours worked or levels of education or the presence of children. Taking all of these variables into account, we still see large gender and racial gaps across most occupations.
- A female dentist, physician or veterinarian with a university degree, working full-time full year, still earns only 74 cents for every dollar their male colleague earns. Women make less than men (working full time, full year) in 471 out of the 500 occupations tracked by the Census. The gap is even larger, as we have seen, for women facing discrimination and other barriers to employment.
The Leadership Gap
- It is interesting to look at the different patterns of education as well. Women tend to have higher rates of participation in university education across the board. The gender gap in women’s favour is minimal between racialized women and men (compared to the gap between non-racialized women and men), but much larger among Indigenous people and those with disabilities. Indigenous women and women with disabilities are much more likely to be university grads compared to their male counterparts.
- These women are putting in the hours at school—but the wage gap remains, and so does the glass ceiling. Racialized and Indigenous women’s share of management jobs is roughly half the share of non-racialized and non-Indigenous men, respectively.
Pushing for better data
One of our goal with The Best and Worst Places to be a Women in Canada is to help spur a national conversation about the challenges many women face and the solutions that are working at the local level—an essential step towards making every community the best place to be a woman in Canada.
In this process, we need to push for better data and information that can illuminate the scope of gender inequality in all of its diversity—to tackle the data gaps that silence and render invisible too many women in our communities.
The most obvious problem with our data deficit is that we don’t have the evidence to flag important issues, to make good decisions, to evaluate the impact of different policies and programs, or to take action to eliminate life damaging disparities.
Reinstating the long form Census was a critical first step, but the challenge is much greater and demands concerted effort and funding from all levels of government. This includes supporting efforts to assert “data sovereignty” among Indigenous peoples through the work of organizations such as the First Nations Information Governance Centre, as well as actively engaging historically marginalized communities in the production and use of information.
This is a challenge for the entire research community to always ask: who’s missing and what can be done to make sure that everyone is in the picture.
Look out for our report and a new fact sheet series at www.policyalternatives.ca
Katherine Scott is a Senior Economist with the Canadian Centre for Policy Alternatives. Follow her on Twitter @ScottKatherineJ.

