Our content is fiercely open source and we never paywall our website. The support of our community makes this possible.
Make a donation of $35 or more and receive The Monitor magazine for one full year and a donation receipt for the full amount of your gift.
This is an update to an earlier post that examined only the Conservative “universal tax cut”. I now have had a bit more time to model the Liberal version and compare the two head to head. These results are also highlighted in a recent Macleans article on the topic. As always, I’m using SPSDM 27.1, Statcan’s tax modelling software, this time with some custom changes. It runs Canadians’ tax details through whatever changes you want to make to our tax system to determine what the costs and distribution of those changes will be.
Specifically, the Liberals want to increase the basic personal exemption to $15,000 (from $13,091) in 2023. But there’s a twist: for those making over $210,371, the basic personal exemption will stay at $13,091.
The other twist is that the Liberals asked the PBO to cost the impact of increasing the basic personal exemption—which is the amount that appears in the Liberals’ platform—but not the spousal and eligible dependent versions. These additional versions, which the Liberals are also committing to, would increase the cost of this measure from the $5.5 billion to $6.0 billion in 2023, or $490 million more than what is cited in the platform (The PBO calculated the basic cost at $5.6 billion in 2023-24 as they are using fiscal years).
$490 million is not a tremendous amount of money for the federal government, but it’s worth noting because it makes the Liberal and Conservative plans essentially identical in cost.
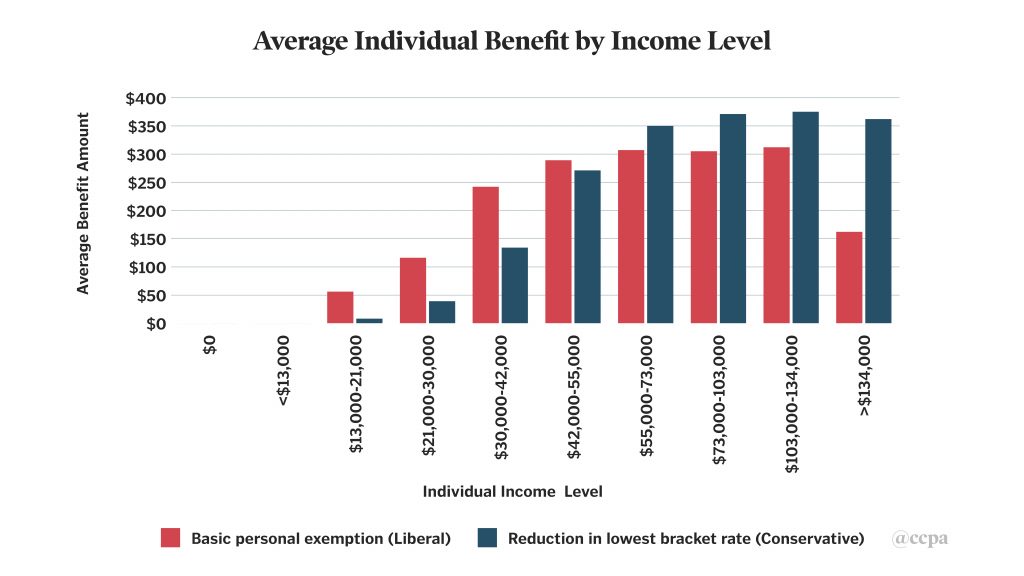
The first graph sorts individuals into deciles of total income. You can pretty clearly see the impact of the Liberal exemption phasing out of at the highest income bracket, compared to the Conservative version which keeps providing its high benefit to the top vigintile (5%). Interestingly, the Liberal plan doesn’t actually claw back the additional benefit until the top 1.5% of earners, which is pretty high. As the graph illustrates, although the 95% percentiles’ break point is at $134K, the clawback for the new Liberal benefit doesn’t even start until $148K, which is in the “>$134K” bar on the first graph, but a ways through it. The net result is that while the top 5% of earners on average get less as a result of the new tax cut than those in the 90th to 95th centile, they still get more than the bottom half of Canadians on average, which as tax policy isn’t tremendously progressive.

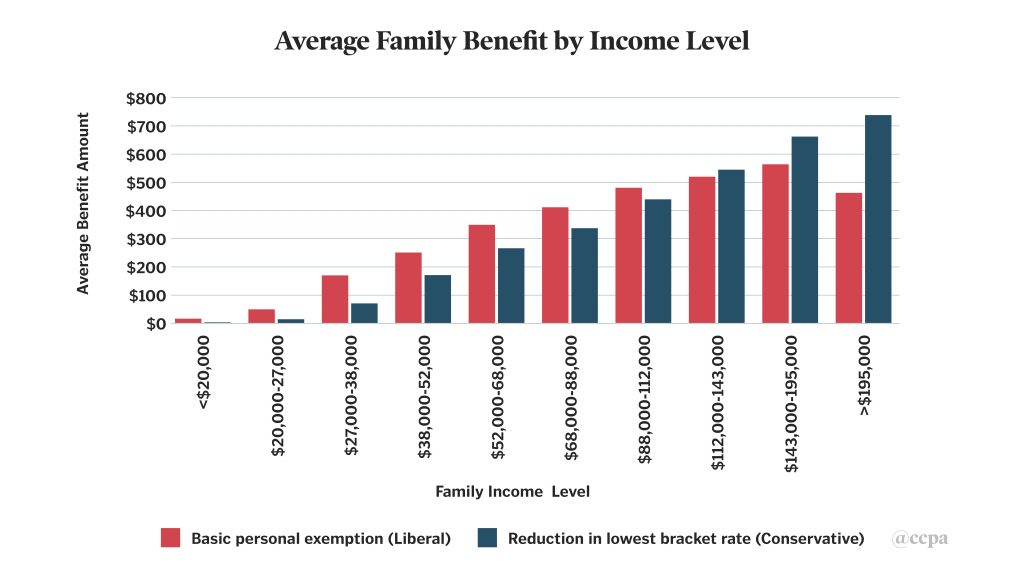
The second graph compares the impact of these tax cuts on families (or unattached households). On the whole, for families, the bite of the clawback appears to have less impact than it does for individuals. Again, there is a slight drop in the average benefit for the top decile in the Liberal plan, but not by that much. The average benefit for the top 10% of families remains higher than the average for the sixth decile or any decile beneath that. So while the Liberal plan is slightly more progressive than the Conservative proposal which provides the biggest benefit to the top decile, it’s still not terribly progressive on the whole.

Any poverty reduction impact from this tax cut is going to be pretty small; a 0.1% reduction in the MBM poverty rate which is essentially a rounding error. And when we consider that both the Liberal and Conservative plans are projected to cost $6 billion a year (a quarter of the total cost of all Canada Child Benefits), that 0.1% reduction becomes quite expensive.
But how much do people expect to get from broad tax cuts? Even at the higher end of the income scale, the average family benefit will be $500, or less, a year. That’s not a cheque in the mail; it’s $42 a month, less than what’s taken off at source by most employers, and unlikely to make a huge difference to most families. In that sense, you’d almost get more political credit for boutique tax cuts despite their general pointlessness. At least they regularly remind you of their existence as you go through a shoebox of receipts, although it doesn’t take that long to realize that you only get 15% back of what you’ve spent on teacher supplies or soccer leagues.
In spite of their modest benefits per family, these types of broad tax changes cost a fortune and, in spite of any number of attempts to make them more progressive through clawbacks, end up having very similar distribution patterns. While the Liberal plan is not quite as generous for the richest families as the Conservative plan is, the broad distributions of both plans are similar, with the bottom income earners getting little to nothing and the top getting at least as much—and usually much more—than those in the middle.
It’s true that sometimes small amounts of money can have real consequences, particularly for families with low income. But there is the opportunity cost to consider as well. How could we have otherwise spent $6 billion a year? This is the sort of annual investment required for a national affordable child care plan. It would easily provide a revolution in wait lists and quality of long-term care in Canada. It would make a huge difference in the construction of green transit projects.
That’s just a sample of what could be done with $6 billion a year. But broad tax cuts forgo collective action in favour of small reductions in individual taxes that disproportionately benefit the wealthiest families at tremendous expense. Perhaps engaging in large scale government actions would be more likely if we didn’t turn to these types of broad but shallow tax cuts.
The CCPA has done extensive research and analysis on a wide range of federal policy issues, most notably through our annual Alternative Federal Budget. As we head towards the October 2019 federal election, we’ll be sharing our independent, non-partisan analysis and fact-checking of campaign promises and platforms from all the major parties.


